Third Quarter 2024
BMO ETFs Guided Portfolio Strategy Report (Q3 2024)
All prices, returns and portfolio weights are as of market close on June 30, 2024, unless otherwise indicated.


Visit bmo.com/etfs or contact Client Services at 1−800−361−1392.
To listen to our Views From the Desk BMO ETF Podcasts, please visit bmoetfs.ca.
BMO ETF Podcasts are also available on


Is a U.S. “Soft Landing” Still in the Cards?
For some time now, central banks in the developed world have been leaning heavily on the “soft landing” scenario. That is, that economies were strong enough to withstand longer periods of restrictive monetary policy without wreaking too much damage on real activity and/or the labour market. For the most part, that narrative held up reasonably well — but of late, there are signs of trouble emerging.
Consider the most recent Federal Open Market Committee (FOMC) meeting. The U.S. Federal Reserve (Fed) left administered rates unchanged but made it clear that concerns are now shifting to how tight current policy is in the context of employment, instead of just inflation. That’s a dovish departure from prior messaging and portends a likely rate cut at the next FOMC meeting in September.
However, by waiting another few months to begin easing, the Fed is implicitly lending more credence to the “soft landing” scenario. In essence, it’s saying that it believes the U.S. labour market can handle some additional time under historically restrictive monetary policy without cracking.
The data is beginning to strike a different tune, though. Indeed, the most recent non-farms payrolls report flagged a rising unemployment rate which was high enough to trigger the much-discussed “Sahm Rule” (See Chart 1).1 Meanwhile, leading indicators on the health of the jobs market forecast problems ahead, with initial jobless claims and layoff notices rising.
Chart 1: The Track Record of the ‘Sahm Rule’ in the U.S.
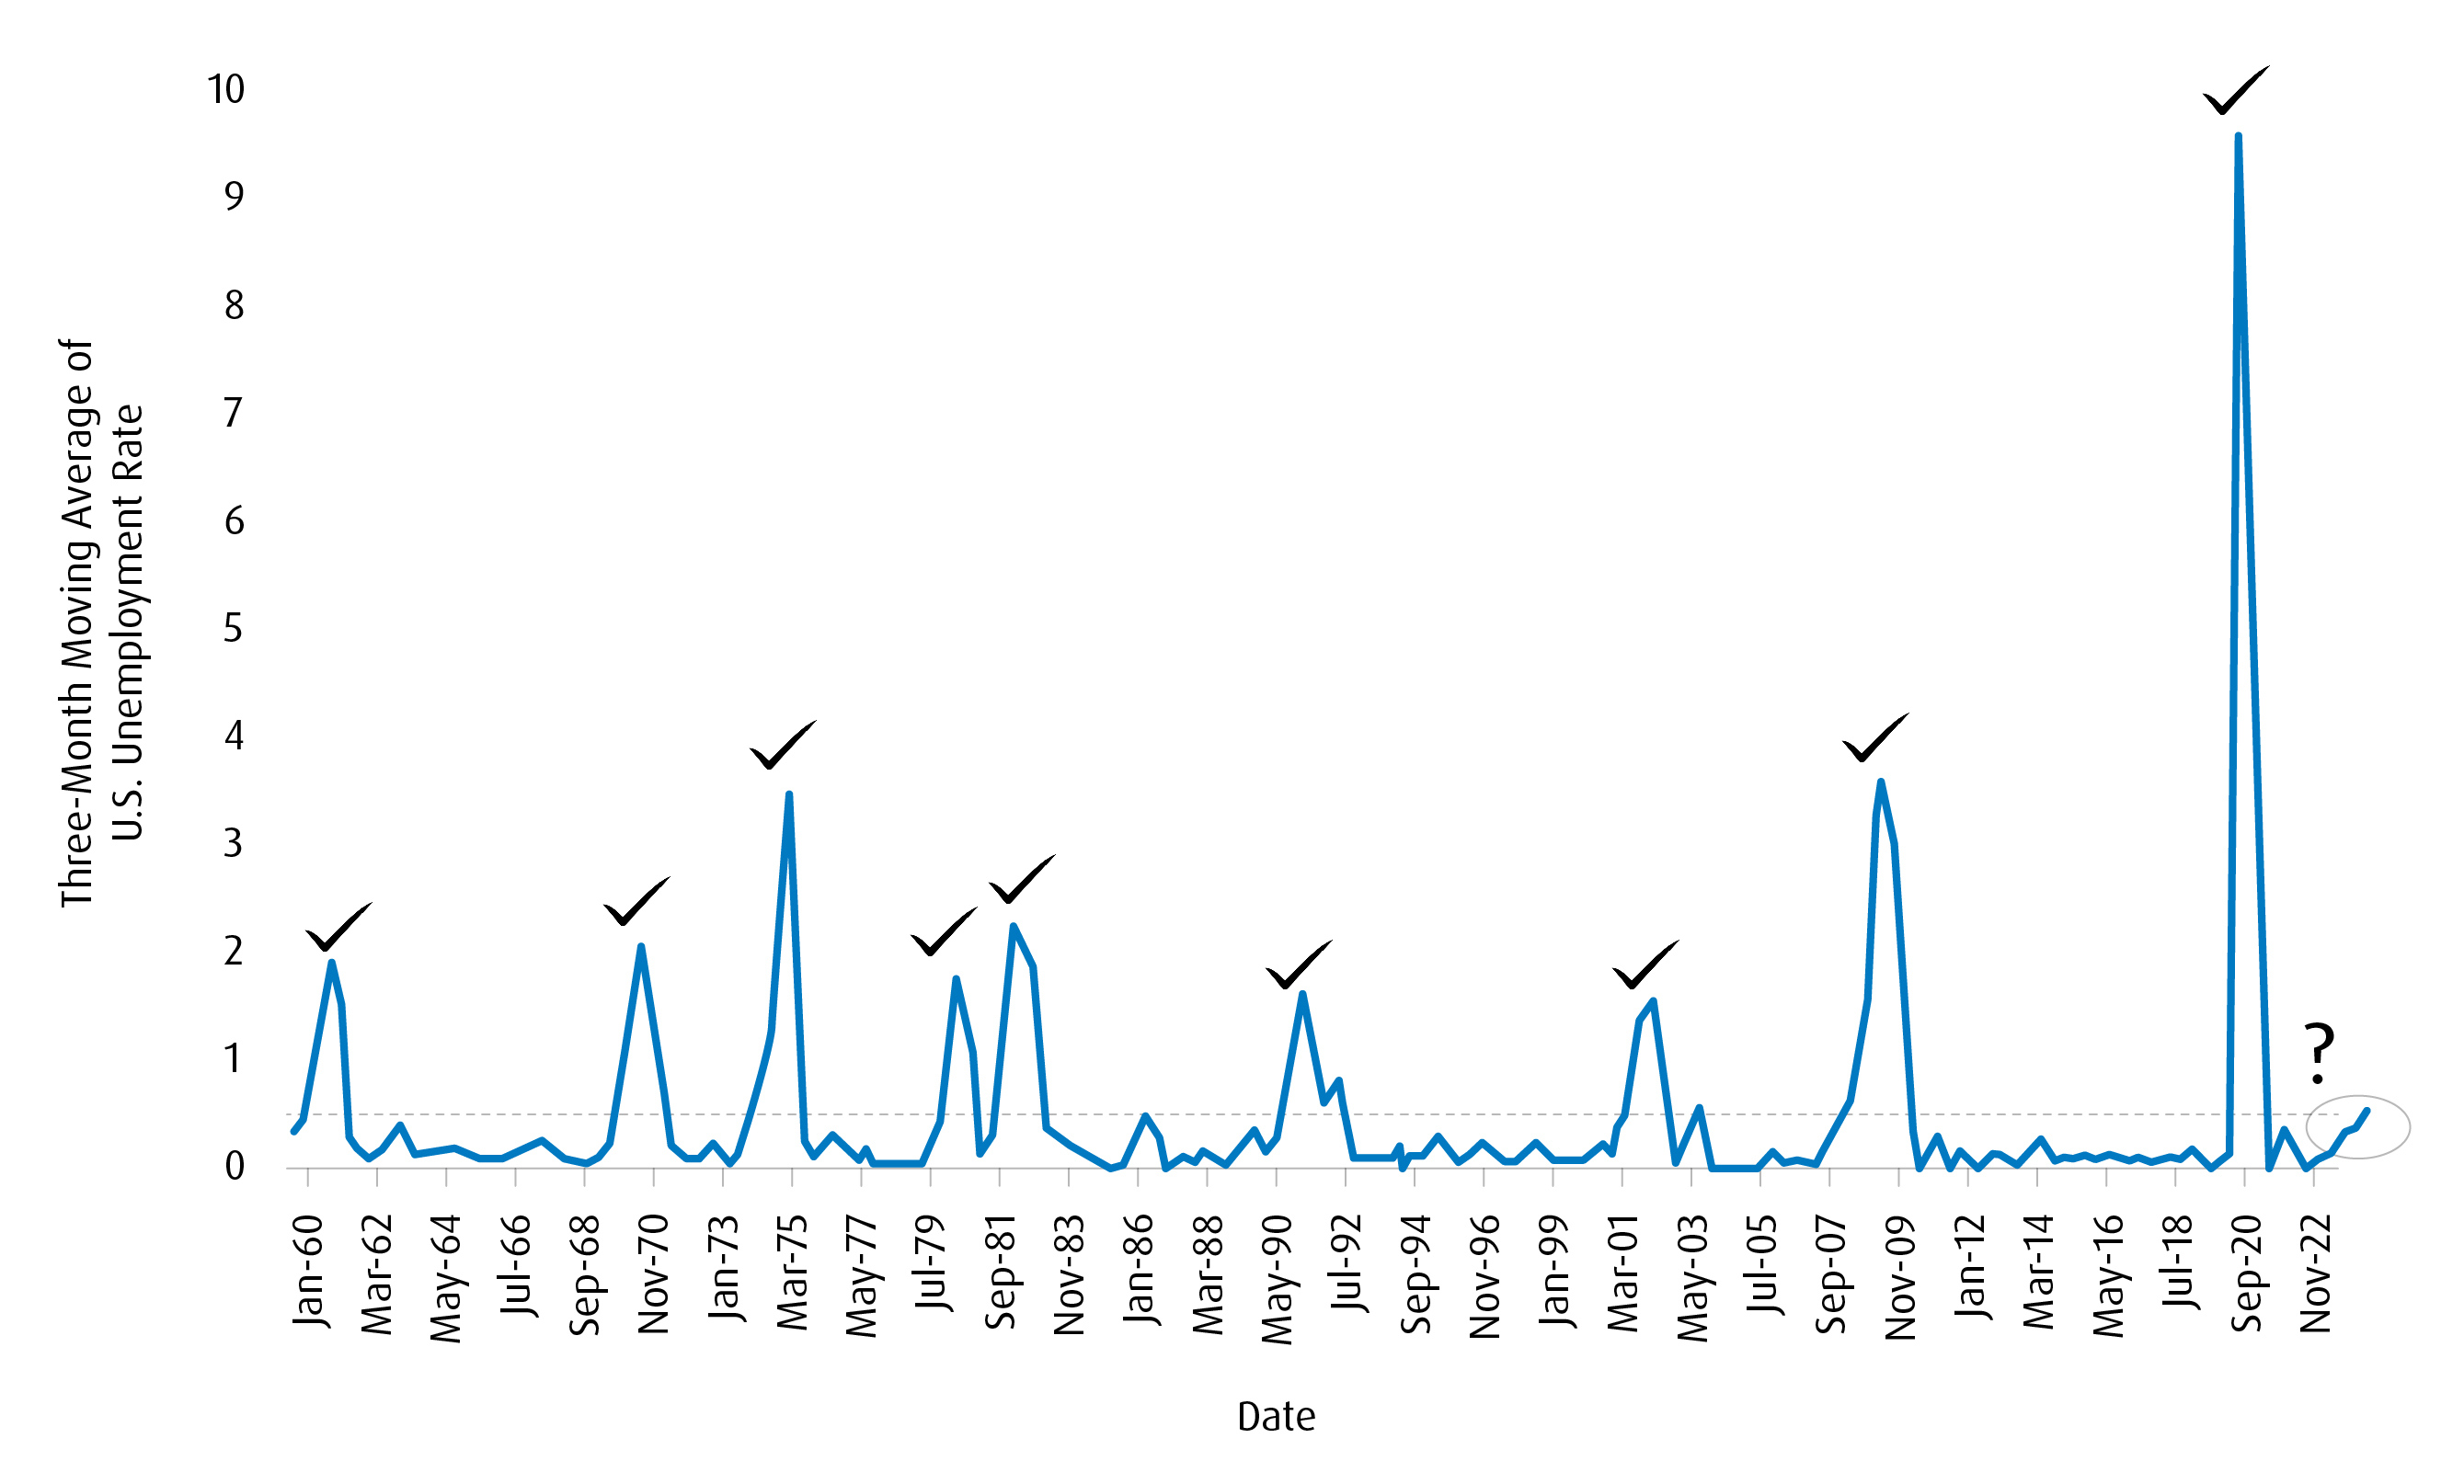
Source: Bureau of Labor Statistics, National Bureau of Economic Research, BMO Asset Management Inc., from January 1960 to November 2022.
Narratives are powerful. Having the “Sahm Rule” triggered at a point when the U.S. yield curve has been inverted for over a year breathes more life into the view that a recession is close at hand in the U.S., and the Fed may be wrong on the “soft landing.” The former was a key catalyst for the broad risk sell-off at the end of July and early August, while the latter has resulted in Overnight Index Swaps (OIS) pricing in rising odds of 50-basis point cuts for the September, November, and December Fed meetings.
Broad Market Risks
Contributing to the bearish tone for risk assets of late are developments in Japan. With the Bank of Japan (BoJ) now entrenched as the most hawkish central bank among advanced economies, higher rates in Japan lead to repatriation of flows and a stronger Japanese Yen (JPY). That triggers broader market pain via two channels: first, it disrupts popular carry trades that relied on cheap JPY funding. Second, it hits Japanese exporter revenues. Both lead to a drawdown in Japanese stocks, and a large amount of position rebalancing in the macro space.
Additionally, while the recent round of U.S. earnings was far from cataclysmic, there are clear signs that momentum is fading. At the same time, geopolitical risks are rising in the Middle East.
We’re sympathetic to views that the market is too aggressive in pricing Fed easing over the coming months. Indeed, as the Fed begins to switch regimes and markets chart the course of the coming cycle, price action won’t be orderly.
BoC Policy Path
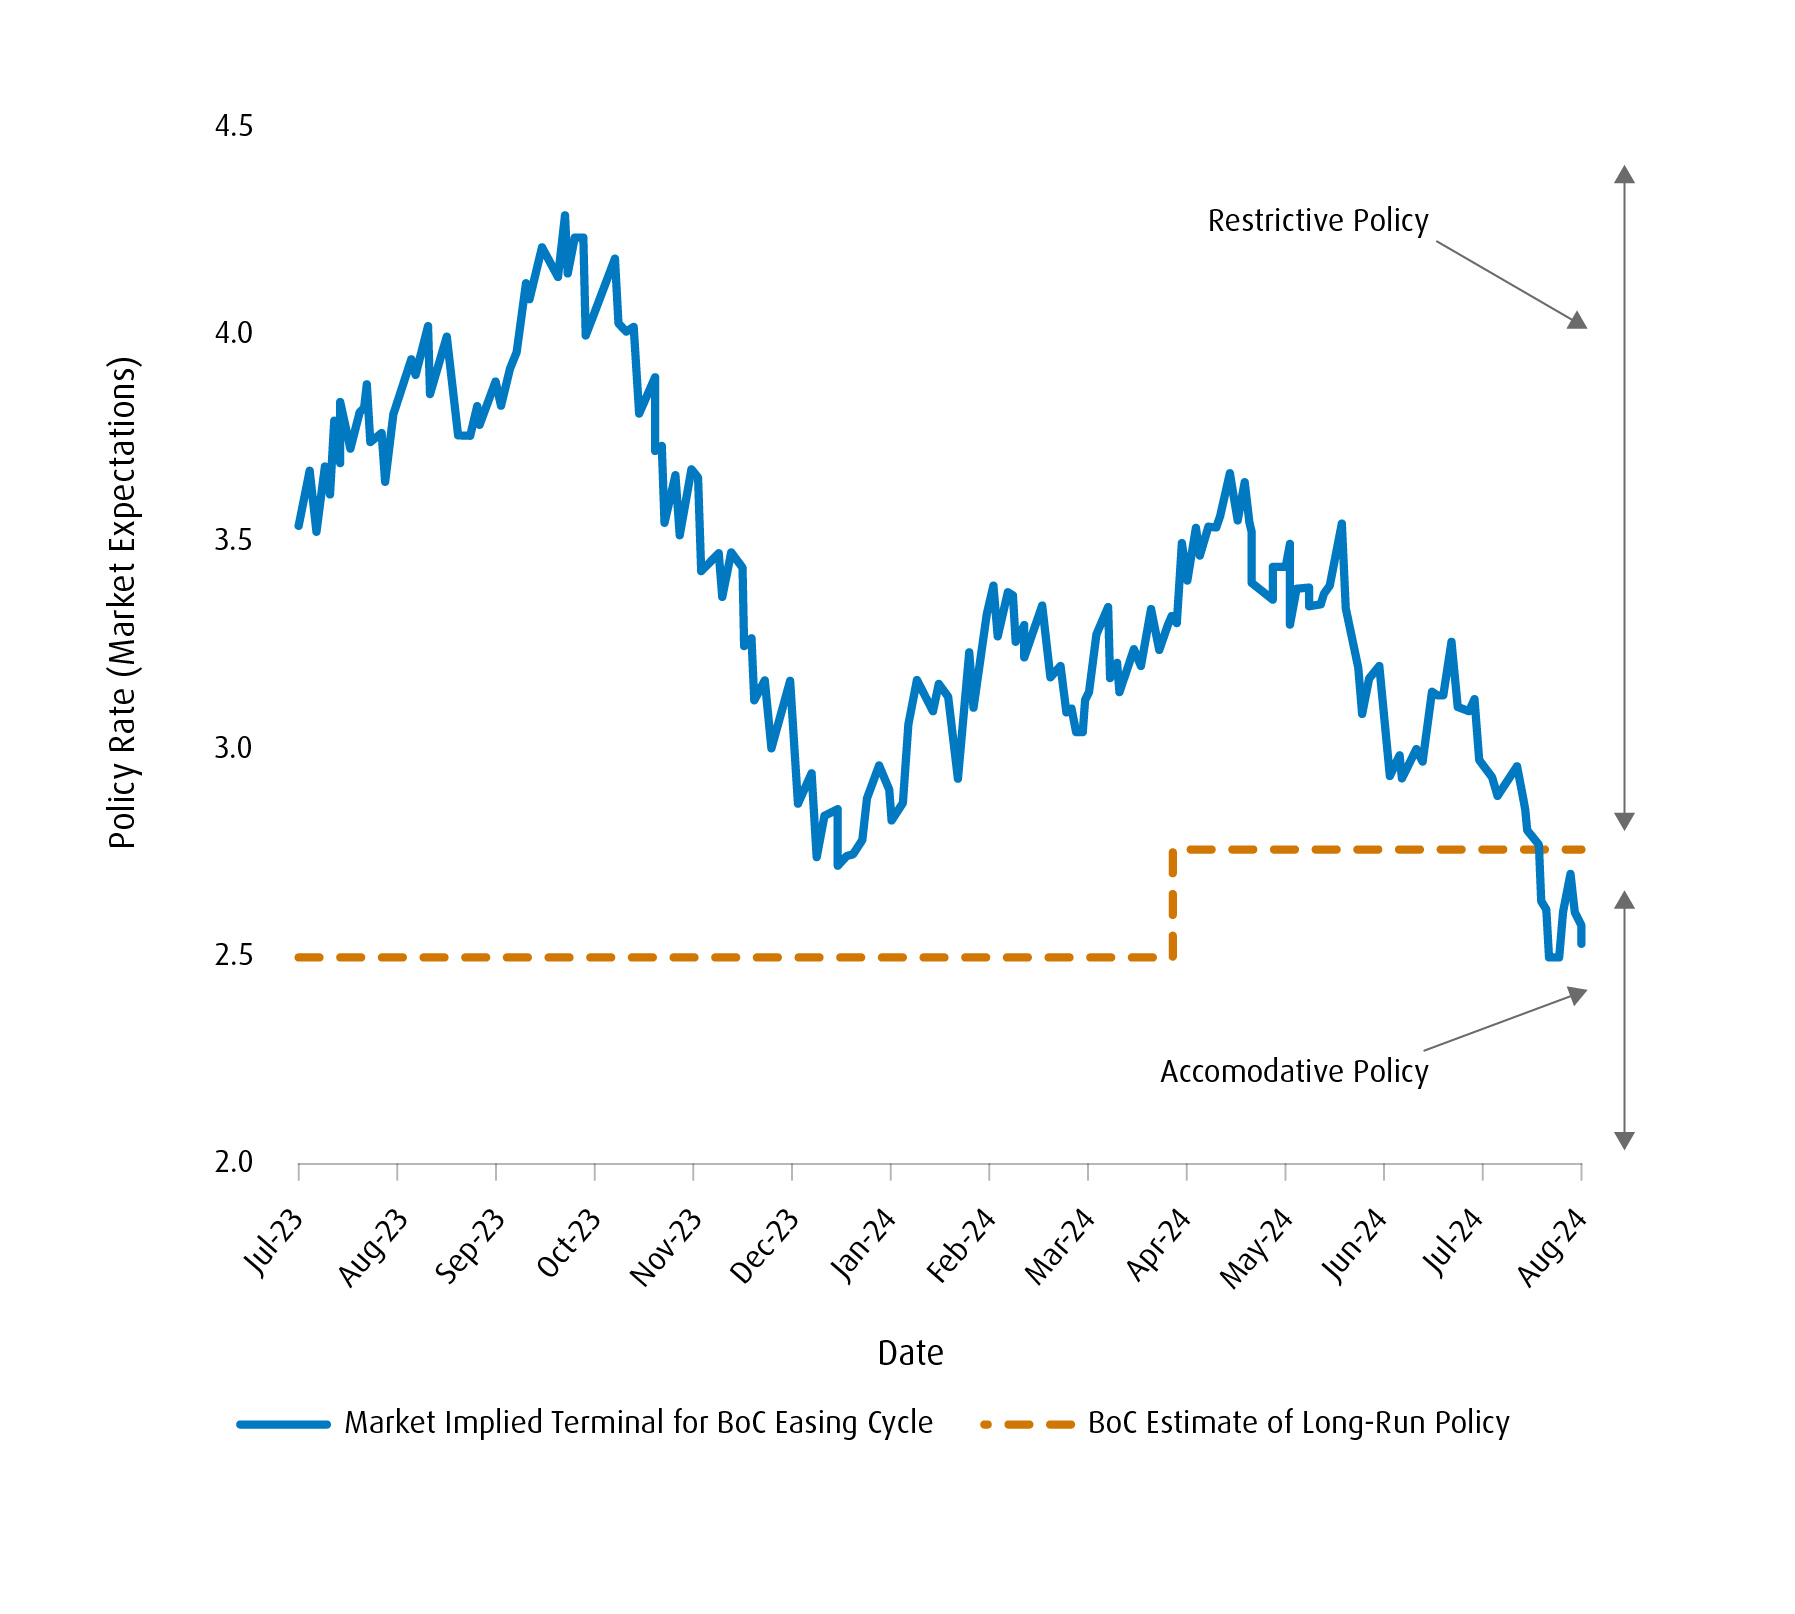
In Canada, on the heels of rate cuts for the June and July meetings, respectively, the Bank of Canada (BoC) is expected to cut at each of the remaining meetings on the calendar (September, October, and December) and into 2025. We’re a bit circumspect on the BoC’s growth forecasts for the coming quarters (1.5% quarter-over-quarter in Q3 and 2.8% quarter-over-quarter in Q4). That’s largely as we envisage household spending potentially falling under considerable pressure from mortgage refinancing risk over the coming years. Forward swaps are pricing the central bank to stop easing once it gets to the 2.50% range for the overnight rate, but there are risks that they could dip below that level during the course of this easing cycle (See Chart 2).
Chart 2: Market Expectations of Orderly BoC Easing Cycle
To us, it makes sense to shift portfolios to reflect a slightly more defensive posture relative to earlier this year. That means a preference for U.S. fixed income with some allocation to investment grade credit. On a sectoral level, a gradual normalization of yield curves should become a more prominent theme into Q4, and favours financials as an outperformer. We see consumer discretionary as a laggard and retain a bias to remain underweight that sector.
Things to Keep an Eye On
Hybrid Portfolio Ballast
With central bank policy rates well above neutral for most regimes, a more traditional interest rate environment has emerged. It does feel like this shift is structural, meaning that we’re not likely to head back to zero rates any time soon. That should mean increased allocations to fixed income in portfolios over time.
Having said this, the rise of alternative assets over the past decade means that the popularity of the traditional 60/40 portfolio isn’t likely to come back in full — particularly as the use of alternative assets has been shown to improve a portfolio’s overall efficiency.2 For instance, exposure to long-short equity strategies, such as the BMO Long Short US Equity ETF (Ticker: ZLSU), would have improved a portfolio’s overall risk/return profile in the context of the recent sell-off.3
Additionally, “buffer” ETFs like the BMO US Equity Buffer Hedged to CAD ETF – July (Ticker: ZJUL) can provide ballast for portfolios.4 These ETFs help investors mitigate losses during periods of intense volatility, while also allowing some participation to the upside. Dividends paid from the underlying are not subject to the downside buffer or the price cap.
Canadian Bonds
The Bank of Canada has cut rates at each of its last two meetings (June and July). For now, we’re in-line with consensus expectations for additional 25-bps cuts for the September, October, and December meetings. But the path beyond that is far less certain yet nevertheless an important consideration for investors.
Forward swaps are pricing the BoC to end the current easing cycle at 2.75% — which is in keeping with where the Bank sees its neutral rate. However, given the stock of household debt and the large number of mortgages that will need to be refinanced in the coming years, we expect that the downside risks to domestic consumption will hold sway. That means that there’s a good chance that the BoC will have to shift policy towards accommodation (meaning below the neutral rate) at some point. That implies the potential for further upside for the BMO Government Bond Index ETF (Ticker: ZGB).
U.S. Front-End Performance
While a recession in the U.S. isn’t quite the base case scenario, it’s clear that the spectrum of possibilities should include a meaningful growth slowdown. The Fed is expected to start easing rates as soon as the September meeting, which suggests that curve normalization will remain a theme into Q4. However, softer data may necessitate more easing to be priced into the USD OIS curve. To us, that suggests legging into ideas that capitalize on outperformance in the front-end of the U.S. Treasury curve. The BMO Short-Term US Treasury Bond Index ETF (Ticker: ZTS) can help take advantage of this theme.
Changes to Portfolio Strategy*
Sell/Trim |
Ticker |
(%) |
Buy/Add |
Ticker |
(%) |
BMO Covered Call Technology ETF |
5.0% |
BMO Government Bond Index ETF |
5.0% |
||
BMO Long-Term US Treasury |
5.0% |
BMO Short-Term US Treasury Bond Index ETF |
ZTS | 5.0% | |
BMO Money Market Fund ETF Series | ZMMK | 3.0% | BMO Ultra Short-Term Bond ETF | ZST | 3.0% |
BMO Equal Weight REITs Index ETF | ZRE | 4.0% | BMO US Equity Buffer Hedged to CAD ETF – July | ZJUL | 4.0% |
*The portfolio holdings are subject to change without notice and only represent a small percentage of portfolio holdings. They are not recommendations to buy or sell any particular security.
Asset Allocation:
We’re a bit more cautious when it comes to the risk backdrop from here. That’s largely because we see compelling signs that fundamentals in the U.S. are shifting, and there is now far more two-way risk when it comes to indicators such as labour market data. While a recession shouldn’t be the base case scenario, the odds have risen and we don’t think the time is ripe to take advantage by going long risk assets
Additionally, the recent batch of earnings releases tell us momentum is waning at the margin. At the very least, that points towards shifting from overweight equities to more neutral.
As mentioned above, our preference is to remain slightly defensive until there’s a more predictable cadence for how the Fed will proceed from here. We like fixed income relative to cash or equities. We see scope for investment grade fixed income to continue to perform, as well.
Equities:
We’re cautiously optimistic on broad risk going forward, and the shifts in the make-up of our balanced portfolio reflect these changes.
In keeping with the defensive posture, we’re sticking with the theme of Quality and Low Volatility as factors. Indeed, both tend to complement each other from a sector exposure perspective
Our core consists of exposures such as the BMO MSCI USA High Quality Index ETF (Ticker: ZUQ) alongside the BMO Low Volatility Canadian Equity ETF (Ticker: ZLB) and BMO Low Volatility US Equity ETF (Ticker: ZLU).
We have exited our positions in BMO Covered Call Technology ETF (Ticker: ZWT) and BMO Equal Weight REITs Index ETF (Ticker: ZRE). As we head into a likely period of slower growth, both of the underlying sectors should underperform. While we acknowledge that covered call strategies can perform during these periods, our preference is to reduce exposure to the Technology sector for now.
Fixed Income:
Given that the Fed has kept policy rates steady for over a year as inflation has declined, the real policy rate is now the tightest it has been since 2007. History has shown that an extended period of restrictive policy can sometimes impair real activity, necessitating deeper policy rate cuts than the market expects.5
With that in mind, we expect curve normalization to be a central theme into Q4. As markets price in the right cadence for Fed rate cuts, we like switching our U.S. Treasury exposure to the front-end of the cash curve. That means adding the BMO Short-Term US Treasury Bond Index ETF (Ticker: ZTS) as a tactical position.
At the same time, we remain circumspect of an orderly easing cycle in Canada. Indeed, we do not think the BoC is paying enough attention to the risks of an extended slowdown, given the considerable degree of mortgage refinancing risks. A way to play this theme is to look at incorporating positions in the BMO Government Bond Index ETF (Ticker: ZGB).
We continue to like yield plays in the front-end of the CAD curve, as well. For instance, the BMO Ultra Short-Term Bond ETF (Ticker: ZST) offers an attractive yield relative to CAD bills.
Non-Traditional/Hybrids:
We’re adding the BMO US Equity Buffer Hedged to CAD ETF – July (Ticker: ZJUL) to our portfolio. Given that broad risk momentum appears to be waning, we feel this product fits with the cautious backdrop and helps to mitigate some downside risk to the portfolio while also allowing for some topside participation.
Indeed, a “target outcome strategy” is often useful for portfolio support during periods of uncertainty. This fund should augment the diversification approach for this part of the portfolio alongside our other non-traditional hybrid positions — including the BMO Long Short US Equity ETF (Ticker: ZLSU).
Stats and Portfolio Holdings
Investment Objective and Strategy:
The strategy involves tactically allocating to multiple asset-classes and geographies to achieve long-term capital appreciation and total return by investing primarily in ETFs
| Ticker | ETF Name | Sector | Positioning | Price | Management Fee* | Weight (%) | 90-Day Volatility | Volatility Contribution | Annualized Distribution Yield (%)** | Yield/Volatility†† |
|---|---|---|---|---|---|---|---|---|---|---|
| Fixed Income | ||||||||||
| ZDB | BMO Discount Bond Index ETF | Fixed Income | Core | $15.09 | 0.09 | 9.00 | 5.97 | 6.63 | 2.41 | 0.40 |
| ZSU | BMO Short-Term US IG Corporate Bond Hedged to CAD Index ETF | Fixed Income | Tactical | $13.45 | 0.25 | 7.00 | 4.31 | 3.72 | 3.42 | 0.79 |
| ZTIP.F | BMO Short-Term US TIPS Index ETF (Hedged Units) | Fixed Income | Tactical | $28.82 | 0.15 | 5.00 | 3.14 | 1.94 | 3.62 | 1.52 |
| ZTS | BMO Short-Term US Treasury Bond Index ETF | Fixed Income | Tactical | $50.43 | 0.20 | 5.00 | 4.51 | 2.78 | 2.94 | 0.65 |
| ZST | BMO Ultra Short-Term Bond ETF | Fixed Income | Tactical | $48.93 | 0.15 | 3.00 | 1.31 | 0.49 | 4.92 | 3.75 |
| ZGB | BMO Government Bond Index ETF | Fixed Income | Tactical | $46.28 | 0.15 | 5.00 | 6.69 | 4.13 | 2.62 | 0.39 |
| Total Fixed Income | 34.0% | 19.69% | ||||||||
| Equities | ||||||||||
| ZLB | BMO Low Volatility Canadian Equity ETF | Equity | Core | $45.91 | 0.35% | 17.00 | 8.60 | 18.04 | 2.42 | 0.28 |
| ZLU | BMO Low Volatility US Equity ETF | Equity | Core | $52.57 | 0.30% | 8.00 | 9.88 | 9.67 | 2.07 | 0.21 |
| ZLD | BMO Low Volatility International Equity Hedged to CAD ETF | Equity | Core | $27.16 | 0.40% | 7.00 | 9.84 | 8.50 | 2.49 | 0.25 |
| ZEO | BMO Equal Weight Oil & Gas Index ETF | Equity | Tactical | $73.46 | 0.55% | 4.00 | 16.08 | 7.94 | 3.85 | 0.24 |
| ZEB | BMO Equal Weight Banks Index ETF | Equity | Tactical | $36.15 | 0.25% | 8.00 | 11.30 | 11.16 | 4.54 | 0.40 |
| ZUQ | BMO MSCI USA High Quality Index ETF | Equity | Core | $81.44 | 0.30% | 12.00 | 14.29 | 21.15 | 0.68 | 0.05 |
| Total Equity | 56.0% | 76.54% | ||||||||
| Non-Traditional Hybrids | ||||||||||
| ZPR | BMO Laddered Preferred Share Index ETF | Hybrid | Tactical | $10.31 | 0.45 | 3.00 | 10.18 | 3.77 | 5.20 | 0.51 |
| ZLSU | BMO Long Short US Equity ETF | Hybrid | Tactical | $36.04 | 0.65 | 3.00 | - | - | - | - |
| ZJUL | BMO US Equity Buffer Hedged to CAD ETF – July | Hybrid | Tactical | $29.85 | 0.65 | 4.00 | - | - | - | - |
| Total Alternatives | 10.00% | 3.77% | ||||||||
| Total Cash | 0.00% | 0.00 | 0.0% | 0.00% | ||||||
| Portfolio | 0.20% | 100.0% | 8.10% | 100.0% | 2.57% | 0.32 |
BMO Global Asset Management, as of August 14, 2024. For illustrative purposes only.
** This yield is calculated by taking the most recent regular distribution, or expected distribution, (excluding additional year end distributions) annualized for frequency, divided by current NAV. The yield calculation does not include reinvested distributions.
†† Yield calculations for bonds are based on yield to maturity, including coupon payments and any capital gain or loss that the investor will realize by holding the bonds to maturity and. For equities, it is based on the most recent annualized income received divided by the market value of the investments. Please note yields of equities will change from month to month based on market conditions. The portfolio holdings are subject to change without notice and only represent a small percentage of portfolio holdings. They are not recommendations to buy or sell any particular security.
Fund Performance (%) |
1-Month |
3-Month |
1-Year |
2-Year |
3-Year |
5-Year |
Since Inception |
Inception Date |
2.33 |
5.37 |
7.41 |
5.11 |
-4.58 |
2.02 |
25.02 |
February 10, 2014 |
|
1.46 |
2.95 |
6.14 |
6.19 |
0.27 |
6.54 |
17.78 |
February 10, 2014 |
|
0.80 |
2.19 |
4.97 |
2.99 |
4.42 |
- |
8.26 |
January 20, 2021 |
|
2.42 |
3.41 |
10.08 |
12.12 |
9.69 |
8.79 |
12.63 |
February 28, 2017 |
|
0.54 |
1.43 |
5.76 |
10.07 |
10.05 |
13.14 |
22.12 |
January 28, 2011 |
|
2.38 |
5.60 |
6.61 |
3.58 |
-5.99 |
-0.91 |
7.95 |
March 02, 2018 |
|
6.48 |
9.28 |
14.73 |
22.99 |
25.88 |
57.01 |
325.94 |
October 21, 2011 |
|
5.96 |
6.58 |
14.40 |
18.12 |
31.03 |
55.53 |
332.58 |
March 19, 2013 |
|
3.82 |
4.51 |
10.50 |
16.81 |
13.51 |
25.66 |
74.83 |
February 10, 2016 |
|
3.27 |
2.83 |
22.85 |
24.41 |
103.10 |
120.84 |
32.08 |
October 20, 2009 |
|
6.71 |
5.88 |
11.72 |
15.63 |
17.38 |
60.17 |
327.34 |
October 20, 2009 |
|
1.18 |
10.70 |
32.49 |
61.44 |
46.86 |
123.84 |
355.42 |
November 5, 2014 |
|
1.73 |
4.08 |
23.36 |
14.45 |
7.71 |
39.68 |
21.10 |
November 14, 2012 |
|
- |
- |
- |
- |
- |
- |
- |
October 2, 2023 |
|
- |
- |
- |
- |
- |
- |
- |
July 2, 2024 |
BMO Global Asset Management, as of July 31, 2024. Past Performance is not indicative of future results.
Portfolio Holdings†
Ticker |
Name |
Weight |
BMO DISCOUNT BOND INDEX ETF |
9.00% |
|
BMO SHORT-TERM US IG CORPORATE |
7.00% |
|
BMO SHORT-TERM US TIPS INDEX ETF (HEDGED UNITS) |
5.00% |
|
BMO SHORT-TERM US TREASURY BOND INDEX ETF |
5.00% |
|
BMO ULTRA SHORT-TERM BOND ETF |
3.00% |
|
BMO GOVERNMENT BOND INDEX ETF |
5.00% |
|
BMO LOW VOLATILITY CANADIAN EQUITY ETF |
17.00% |
|
BMO LOW VOLATILITY US EQUITY ETF |
8.00% |
|
BMO LOW VOLATILITY INTERNATIONAL |
7.00% |
|
BMO EQUAL WEIGHT OIL & GAS INDEX ETF |
4.00% |
|
BMO EQUAL WEIGHT BANKS INDEX ETF |
8.00% |
|
BMO MSCI USA HIGH QUALITY INDEX ETF |
12.00% |
|
BMO LADDERED PREFERRED SHARE INDEX ETF |
3.00% |
|
BMO LONG SHORT US EQUITY ETF |
3.00% |
|
BMO US EQUITY BUFFER HEDGED TO CAD ETF – JULY |
4.00% |
|
TOTAL |
100.00% |
|
†The portfolio holdings are subject to change without notice and only represent a small percentage of portfolio holdings. They are not recommendations to buy or sell any particular security. As at June 30, 2024. | ||

Portfolio Characteristics
Regional Breakdown (Overall Portfolio)

Equity Sector Breakdown

Fixed Income Sector Breakdown
Federal |
48.1% |
Weighted Average Term |
5.48 |
Provincial |
15.4% |
Weighted Average Duration |
4.38 |
Investment Grade Corporate |
36.0% |
Weighted Average Coupon (%) |
2.55 |
Non-Investment Grade Corporate |
0.0% |
Annualized Distribution Yield (%) |
3.02 |
Municipal |
0.5% |
Weighted Average Yield to Maturity (%) |
4.21 |
Weighted Average Term: The average interest received by a bond investor, expressed on a nominal annual basis.
Weighted Average Current Yield: The market value-weighted average coupon divided by the weighted average market price of bonds.
Weighted Average Yield to Maturity: The market value-weighted average yield to maturity includes coupon payments and any capital gain or loss that the investor will realize by holding the bonds to maturity.
Weighted Average Duration: The market value-weighted average duration of underlying bonds divided by the weighted average market price of the underlying bonds. Duration is a measure of the sensitivity of the price of a fixed income investment to a change in interest rates.
Weighted Average Coupon: The average time it takes for bonds to mature in a fixed income portfolio.
The portfolio holdings are subject to change without notice and only represent a small percentage of portfolio holdings. They are not recommendations to buy or sell any particular security.
Source: Bloomberg, BMO Asset Management Inc., as of August 14, 2024.
1 The Sahm Rule identifies signals related to the start of a recession when the three-month moving average of the national unemployment rate rises by 0.50 percentage points or more relative to its low during the previous 12 months. It is meant to serve as a theoretical indicator of possible recession.
2 Denis Schweizer, Portfolio Optimization with Alternative Investments, January 2008.
3 Based on ETF market performance, which has been positive. Unable to use in performance data because ETF is less than a year old. Please refer to historical NAV since inception (October 2, 2023).
4 BMO Buffer ETFs seeks to provide income and appreciation that match the return of a Reference Index up to a cap (before fees, expenses and taxes), while providing a buffer against the first 15% (before fees, expenses and taxes) of a decrease in the Reference Index over a period of approximately one year, starting from the first business day of the stated outcome period.
5 Tim Sablik, Federal Reserve History: Recession of 1981-82, Federal Reserve Bank of Richmond.
Disclaimers:
No portion of this communication may be reproduced or distributed to clients.
Volatility: Measures how much the price of a security, derivative, or index fluctuates. The most commonly used measure of volatility when it comes to investment funds is standard deviation.
Yield curve: A line that plots the interest rates of bonds having equal credit quality but differing maturity dates. A normal or steep yield curve indicates that long-term interest rates are higher than short-term interest rates. A flat yield curve indicates that short-term rates are in line with long-term rates, whereas an inverted yield curve indicates that short-term rates are higher than long-term rates.
Any statement that necessarily depends on future events may be a forward-looking statement. Forward-looking statements are not guarantees of performance. They involve risks, uncertainties and assumptions. Although such statements are based on assumptions that are believed to be reasonable, there can be no assurance that actual results will not differ materially from expectations. Investors are cautioned not to rely unduly on any forward-looking statements. In connection with any forward-looking statements, investors should carefully consider the areas of risk described in the most recent simplified prospectus.
The viewpoints expressed by the individuals represents their assessment of the markets at the time of publication. Those views are subject to change without notice at any time. The information provided herein does not constitute a solicitation of an offer to buy, or an offer to sell securities nor should the information be relied upon as investment advice. Past performance is no guarantee of future results. This communication is intended for informational purposes only.
This communication is for information purposes. The information contained herein is not, and should not be construed as, investment, tax or legal advice to any party. Particular investments and/or trading strategies should be evaluated relative to the individual’s investment objectives and professional advice should be obtained with respect to any circumstance.
Index returns do not reflect transactions costs or the deduction of other fees and expenses and it is not possible to invest directly in an Index. Past performance is not indicative of future results.
The Index is a product of S&P Dow Jones Indices LLC or its affiliates (“SPDJI”), and has been licensed for use by the Manager. S&P®, S&P 500®, US 500, The 500, iBoxx®, iTraxx® and CDX® are trademarks of S&P Global, Inc. or its affiliates (“S&P”) and Dow Jones® is a registered trademark of Dow Jones Trademark Holdings LLC (“Dow Jones”), and these trademarks have been licensed for use by SPDJI and sublicensed for certain purposes by the Manager. The ETF is not sponsored, endorsed, sold or promoted by SPDJI, Dow Jones, S&P, their respective affiliates, and none of such parties make any representation regarding the advisability of investing in such product(s) nor do they have any liability for any errors, omissions, or interruptions of the Index.
The ETFs referred to herein is not sponsored, endorsed, or promoted by MSCI and MSCI bears no liability with respect to the ETF or any index on which such ETF is based. The ETF’s prospectus contains a more detailed description of the limited relationship MSCI has with the Manager and any related ETF.
Commissions, management fees and expenses all may be associated with investments in exchange traded funds. Please read the ETF Facts or prospectus of the BMO ETFs before investing. The indicated rates of return are the historical annual compounded total returns including changes in unit value and reinvestment of all dividends or distributions and do not take into account sales, redemption, distribution or optional charges or income taxes payable by any unitholder that would have reduced returns. Exchange traded funds are not guaranteed, their values change frequently and past performance may not be repeated.
For a summary of the risks of an investment in the BMO ETFs, please see the specific risks set out in the BMO ETF’s prospectus. BMO ETFs trade like stocks, fluctuate in market value and may trade at a discount to their net asset value, which may increase the risk of loss. Distributions are not guaranteed and are subject to change and/or elimination.
BMO ETFs are managed by BMO Asset Management Inc., which is an investment fund manager and a portfolio manager, and a separate legal entity from Bank of Montreal.
BMO Global Asset Management is a brand name under which BMO Asset Management Inc. and BMO Investments Inc. operate.
Distribution yields are calculated by using the most recent regular distribution, or expected distribution, (which may be based on income, dividends, return of capital, and option premiums, as applicable) and excluding additional year end distributions, and special reinvested distributions annualized for frequency, divided by month end net asset value (NAV). The yield calculation does not include reinvested distributions. Distributions are not guaranteed, may fluctuate and are subject to change and/or elimination. Distribution rates may change without notice (up or down) depending on market conditions and NAV fluctuations. The payment of distributions should not be confused with the BMO ETF’s performance, rate of return or yield. If distributions paid by a BMO ETF are greater than the performance of the investment fund, your original investment will shrink. Distributions paid as a result of capital gains realized by a BMO ETF, and income and dividends earned by a BMO ETF, are taxable in your hands in the year they are paid. Your adjusted cost base will be reduced by the amount of any returns of capital. If your adjusted cost base goes below zero, you will have to pay capital gains tax on the amount below zero.
Cash distributions, if any, on units of a BMO ETF (other than accumulating units or units subject to a distribution reinvestment plan) are expected to be paid primarily out of dividends or distributions, and other income or gains, received by the BMO ETF less the expenses of the BMO ETF, but may also consist of non-taxable amounts including returns of capital, which may be paid in the manager’s sole discretion. To the extent that the expenses of a BMO ETF exceed the income generated by such BMO ETF in any given month, quarter, or year, as the case may be, it is not expected that a monthly, quarterly, or annual distribution will be paid. Distributions, if any, in respect of the accumulating units of BMO Short Corporate Bond Index ETF, BMO Short Federal Bond Index ETF, BMO Short Provincial Bond Index ETF, BMO Ultra Short-Term Bond ETF and BMO Ultra Short-Term US Bond ETF will be automatically reinvested in additional accumulating units of the applicable BMO ETF. Following each distribution, the number of accumulating units of the applicable BMO ETF will be immediately consolidated so that the number of outstanding accumulating units of the applicable BMO ETF will be the same as the number of outstanding accumulating units before the distribution. Non-resident unitholders may have the number of securities reduced due to withholding tax. Certain BMO ETFs have adopted a distribution reinvestment plan, which provides that a unitholder may elect to automatically reinvest all cash distributions paid on units held by that unitholder in additional units of the applicable BMO ETF in accordance with the terms of the distribution reinvestment plan. For further information, see the distribution policy in the BMO ETFs’ prospectus.
“BMO (M-bar roundel symbol)” is a registered trademark of Bank of Montreal, used under licence.