Fixed Income Strategy Report (Q2 2025)
Apr. 2, 2025Fixed Income Portfolio for Q2 2025
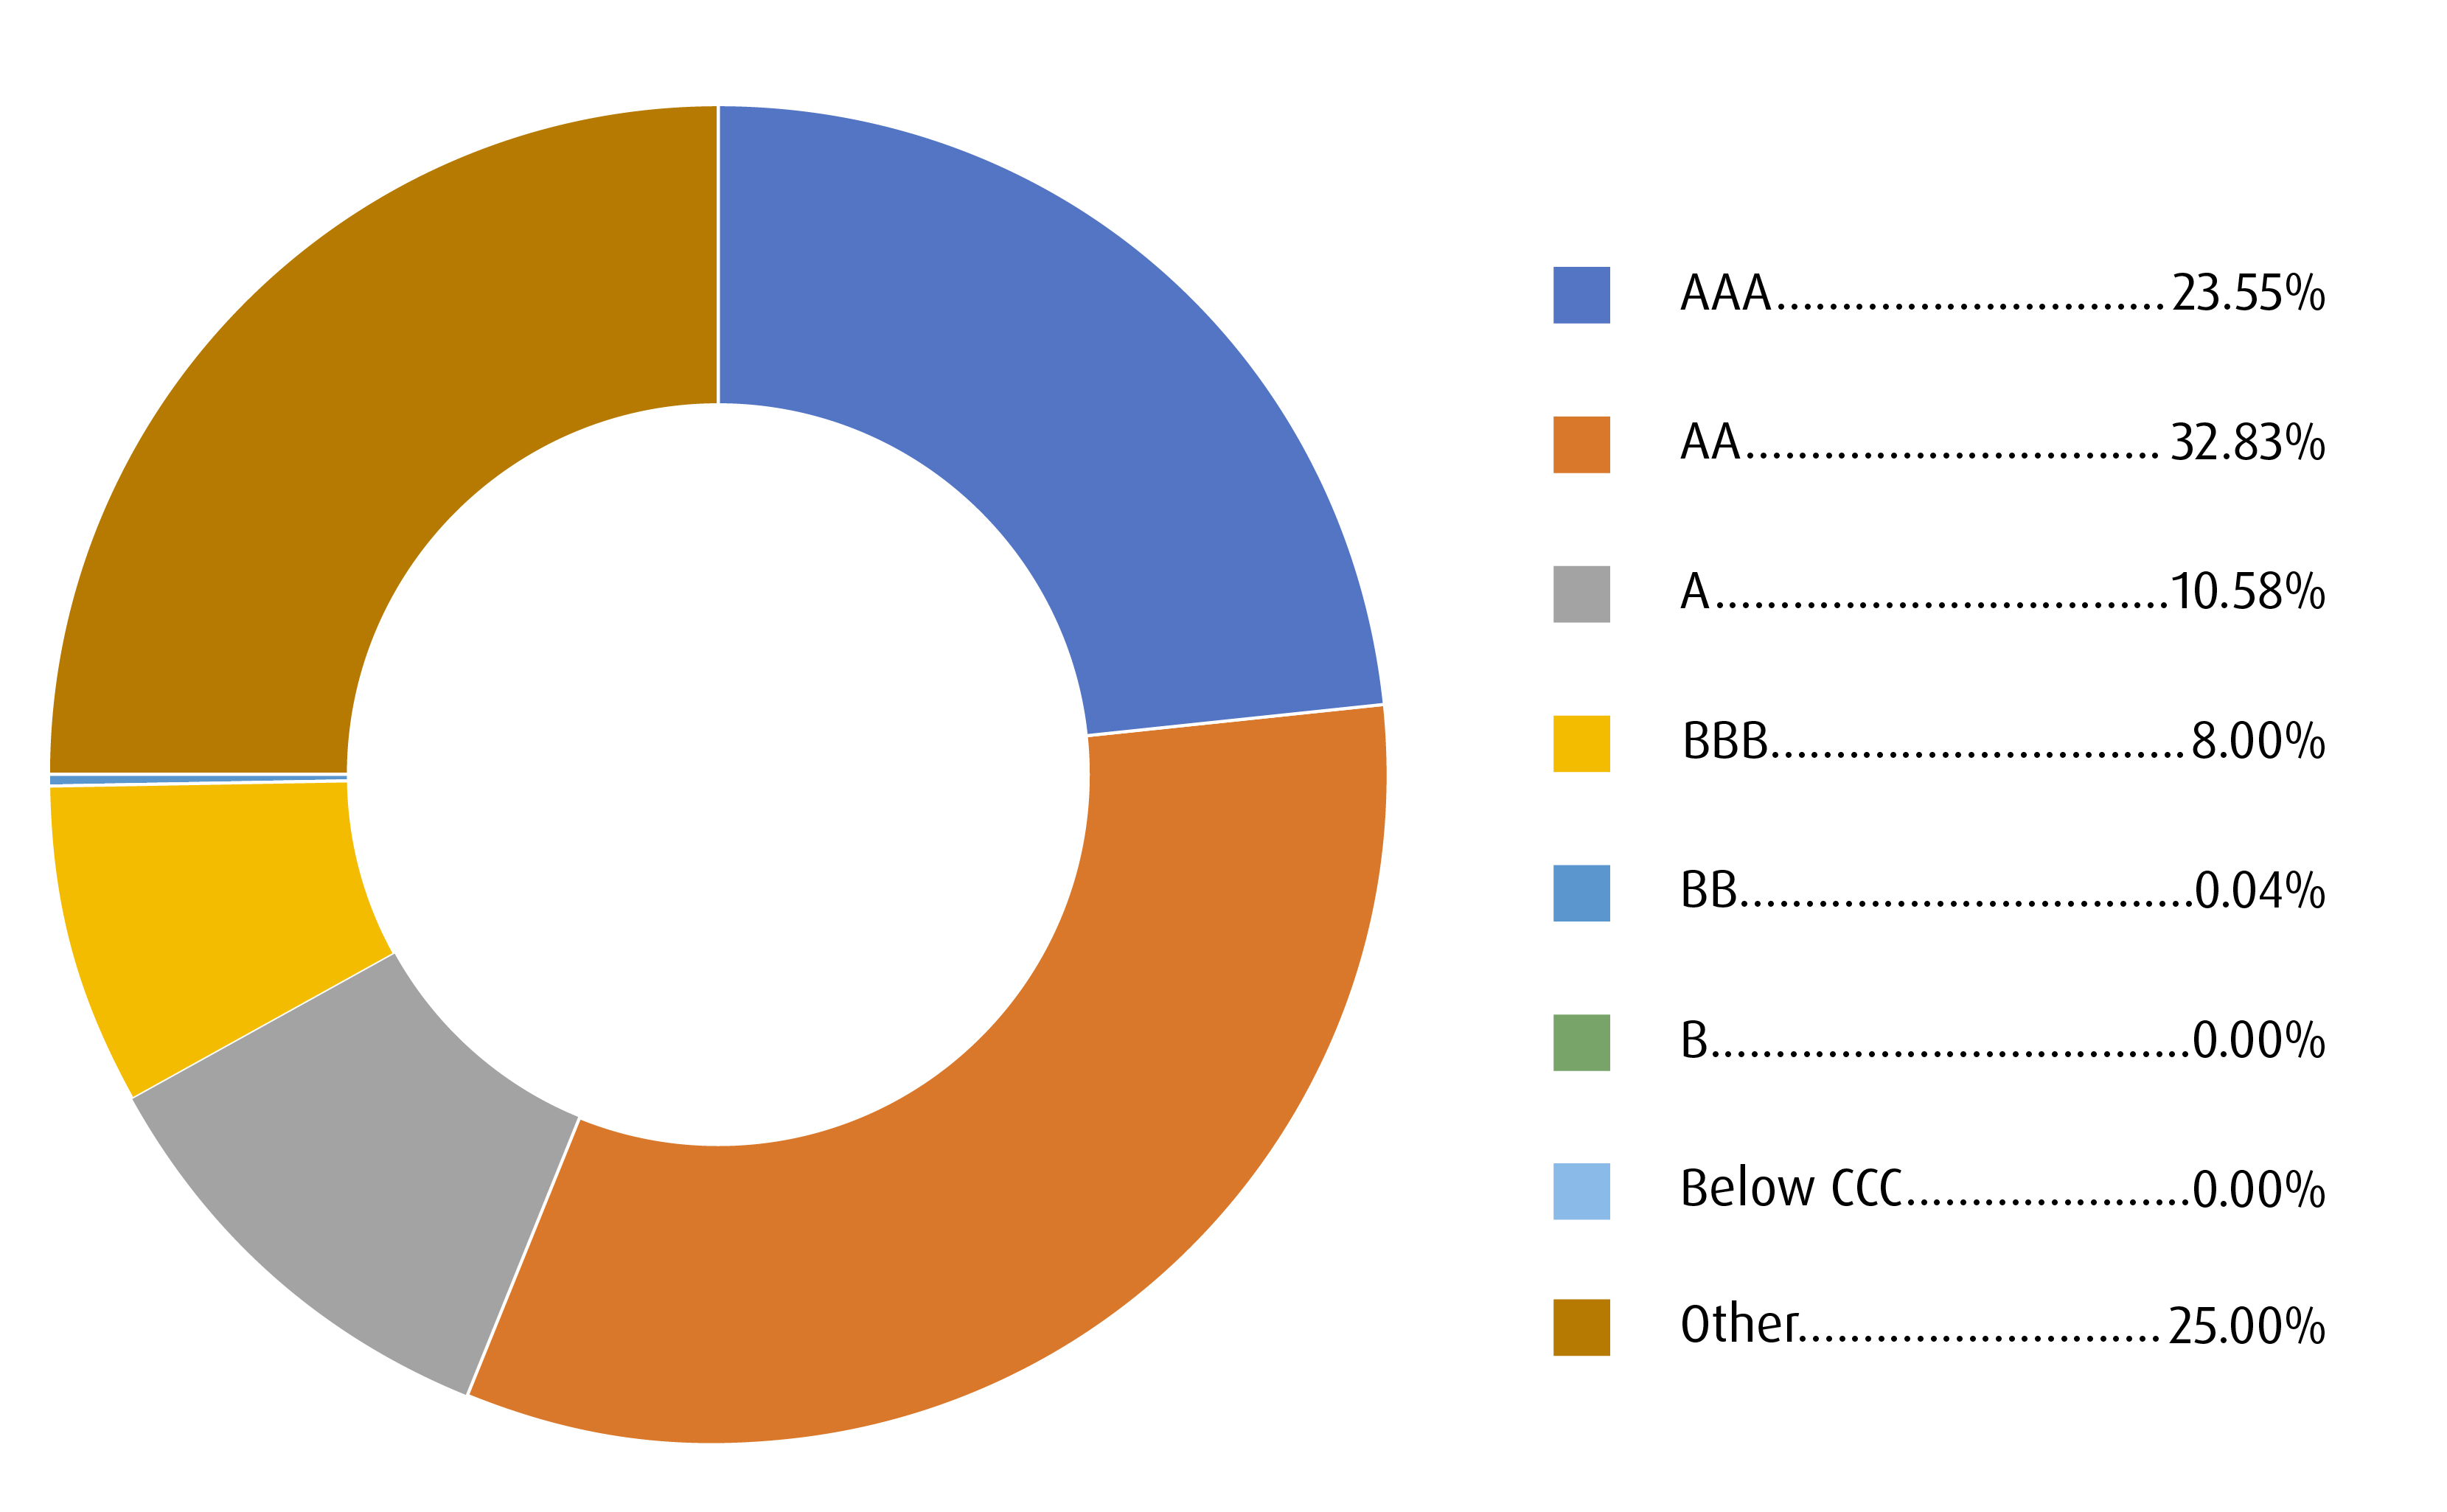
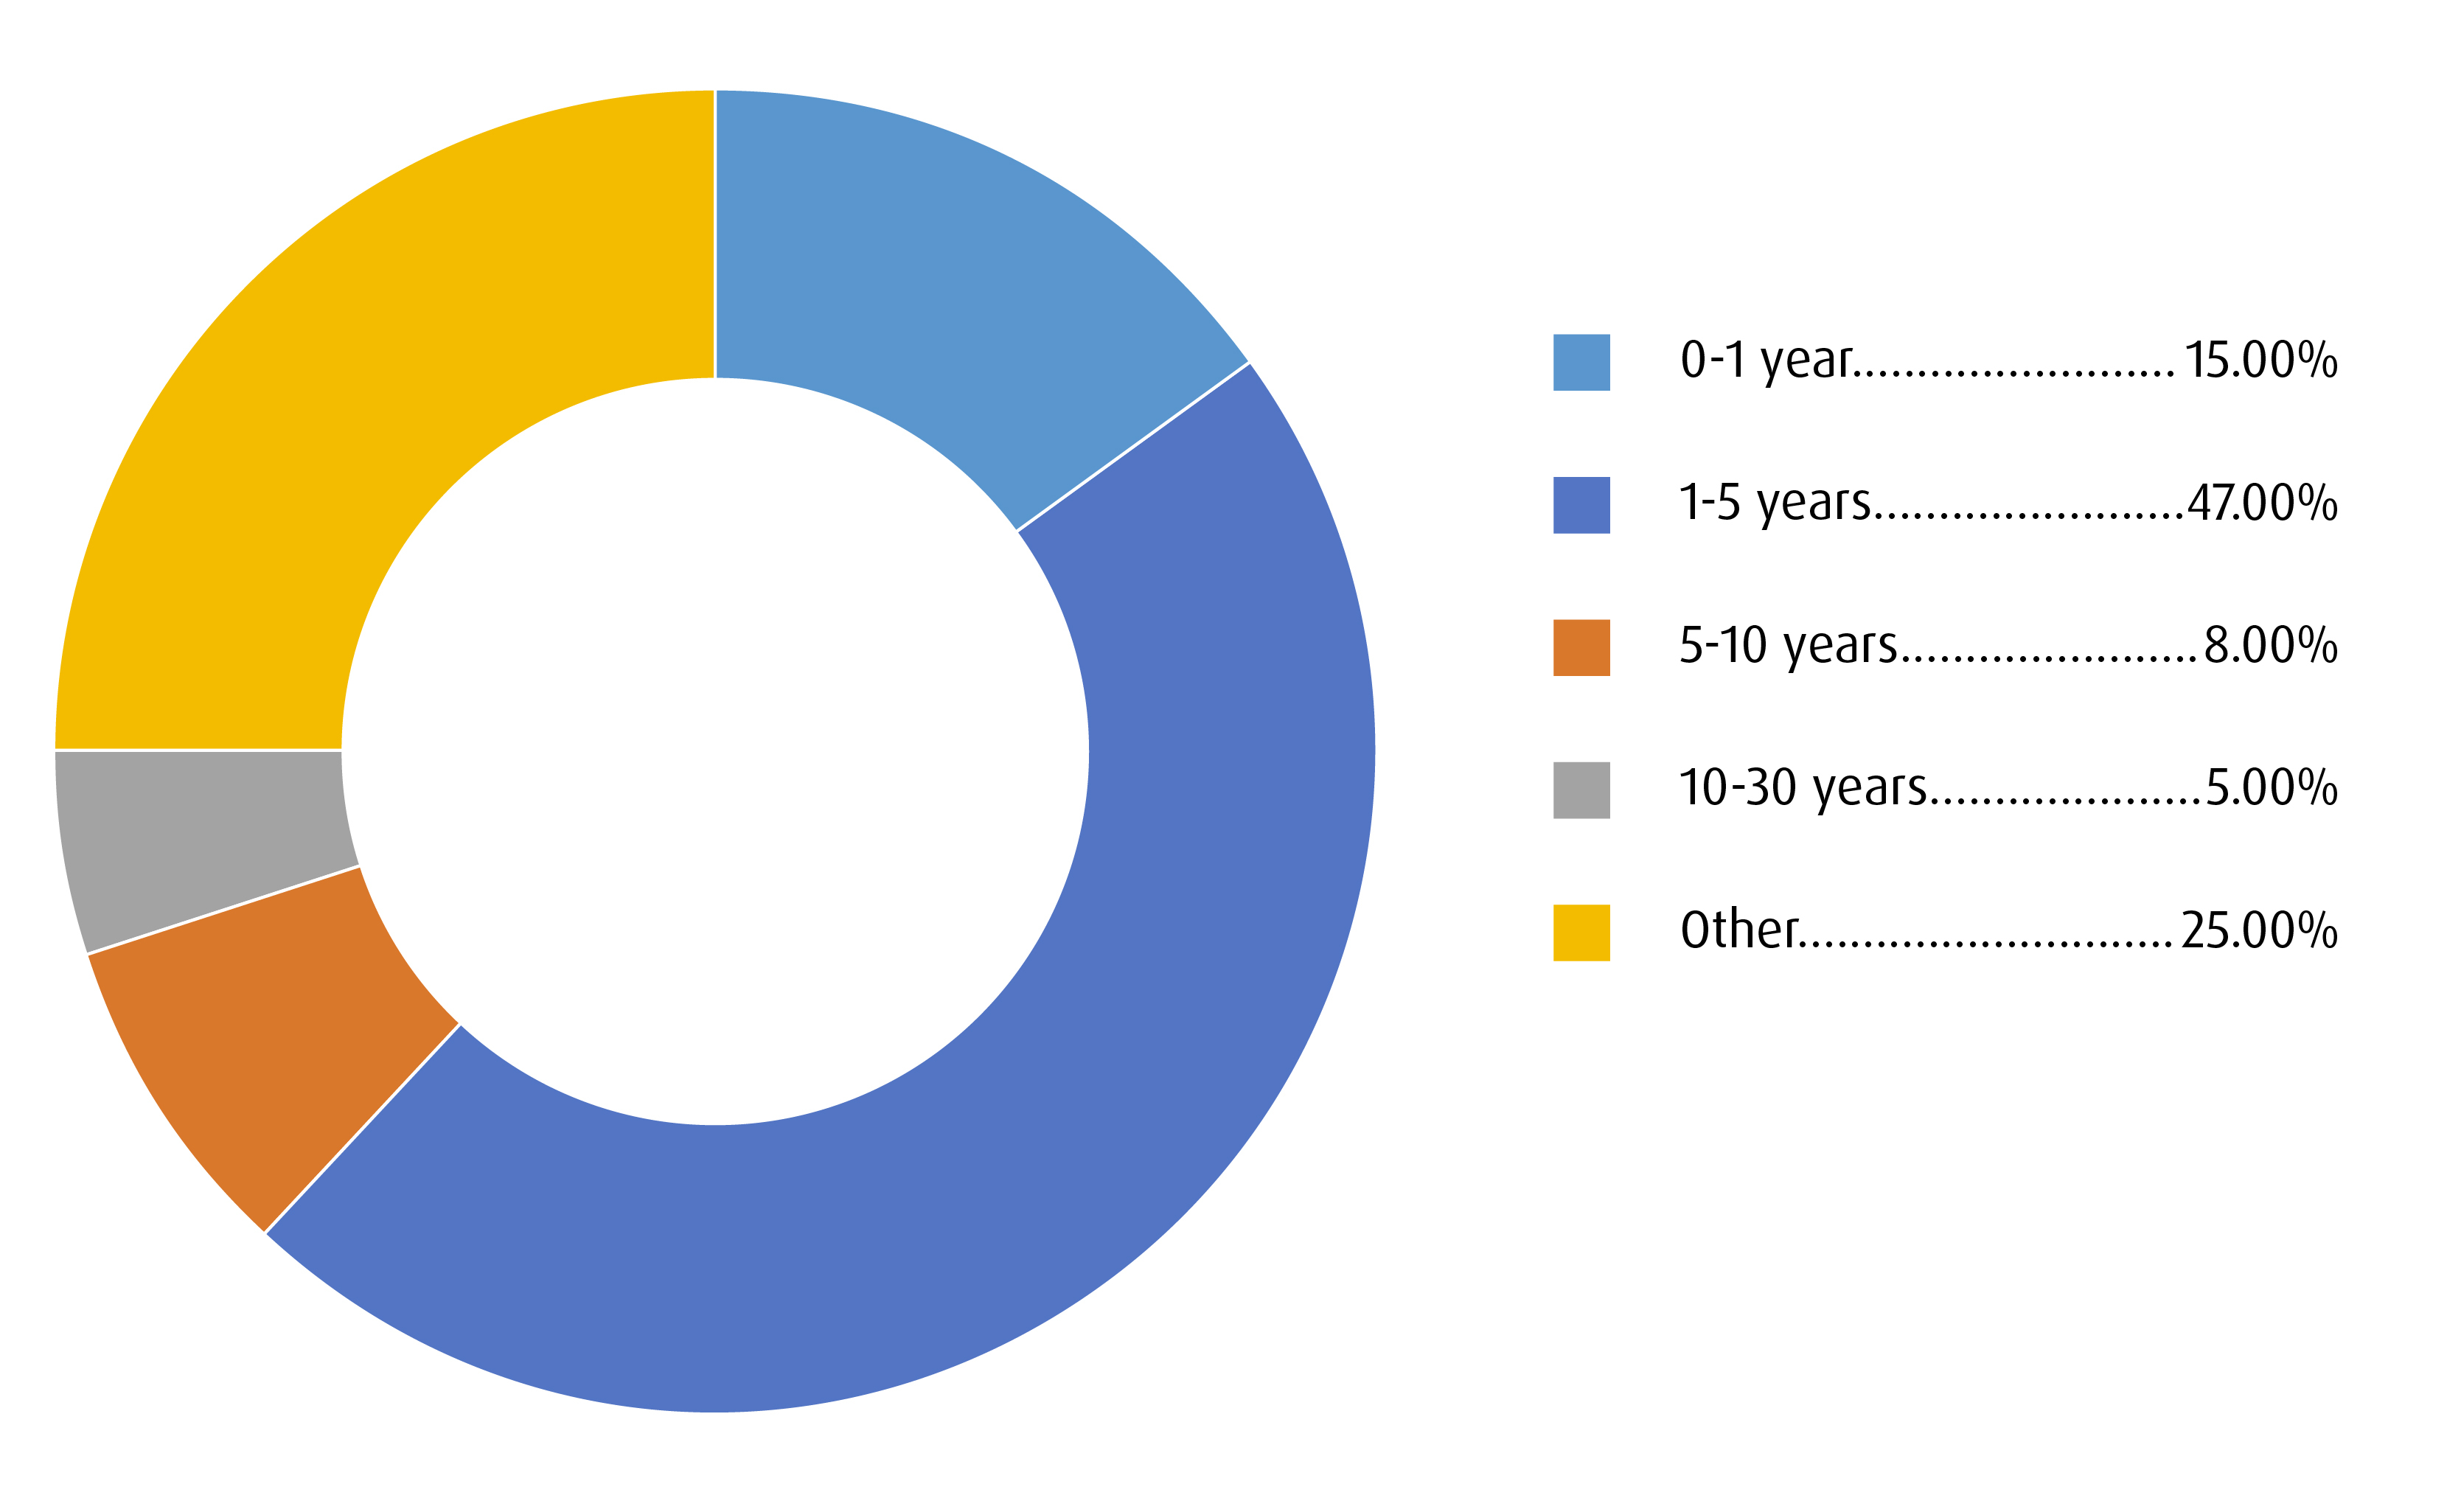
- Given the backdrop, the priority for our fixed income portfolio is to focus on strong credit and to optimize yield at a shorter duration.1
- In the U.S., data that tracks the real economy appears to be slowing, but we don’t get the sense that the Federal Reserve is in any hurry to ease policy rates. That’s largely due to the potential from ‘stickier’ consumer prices as tariffs start to make their presence felt.
- As such, any surprise from stronger-than-expected economic data could make its presence felt further out the curve.2 That accentuates the greater “two-way” risk to duration that we see at this point. For now, we have stronger conviction on real yields3 in the U.S., which look elevated at this point and we have allocated a portion of our portfolio to ZTIP.
- Additionally, our preference is to maintain some liquidity given the uncertain nature of tariffs and the passthrough effect on markets. Given this, we are allocating some weight to ZUCM.
- In Canada, some of the outperformance of the sovereign curve has been given back over the past month. While tariffs represent important risks over the medium-term, we get the sense that the market is reticent to reprice the Bank of Canada on the expectation that fiscal stimulus is likely to be forthcoming in the coming quarters.
- In the near-term, it does appear that the CAD curve feels a bit rich. We’ll likely need material weakness in real economic data before it makes sense to add to long positions in the CAD curve. But for now, we’re happy to roll with our current positions in ZDB (albeit at a lower weight relative to Q1), ZPR and ZBI.
ETF Name |
Ticker |
Weight |
Duration |
YTM* |
Management Fee |
Exposure |
Position |
20.00% |
7.20 |
3.29% |
0.09% |
Canada |
Core |
||
25.00% |
3.05 |
6.65% |
0.45% |
Canada |
Core |
||
25.00% |
2.21 |
4.09% |
0.25% |
Canada |
Core |
||
15.00% |
2.45 |
4.28% |
0.20% |
United States |
Non-Traditional |
||
15.00% |
0.16 |
4.29% |
0.25% |
United States |
Non-Traditional |
BMO Global Asset Management. For illustrative purposes only. The information contained herein is not, and should not be construed as, investment, tax or legal advice to any party. These are not recommendations to buy or sell any particular security. Particular investments and/or trading strategies should be evaluated relative to the individual’s risk profile and investment objectives. Professional advice should be obtained with respect to any circumstance.
* Weighted average yield to maturity: The market value-weighted average yield to maturity includes coupon payments and any capital gain or loss that the investor will realize by holding the bonds to maturity.
Source: Bloomberg, BMO Asset Management Inc., as of March 31, 2025.
Fund Performance (%)
Ticker |
Year-to-Date |
1-Month |
3-Month |
6-Month |
1-Year |
3-Year |
5-Year |
10-Year |
Since Inception |
2.01 |
-0.26 |
2.01 |
1.87 |
7.56 |
2.42 |
0.83 |
1.65 |
2.41 |
|
2.13 |
-0.38 |
2.13 |
7.09 |
17.21 |
5.35 |
14.79 |
3.93 |
2.57 |
|
1.14 |
-0.20 |
1.14 |
3.12 |
9.05 |
4.80 |
- |
- |
3.79 |
|
3.12 |
0.36 |
3.12 |
9.46 |
13.52 |
8.09 |
- |
- |
6.56 |
|
1.14 |
-0.20 |
1.14 |
8.74 |
11.44 |
- |
- |
- |
9.59 |
Bloomberg, as of March 31, 2025. Inception date for ZDB = February 10, 2014, ZPR = November 14, 2012, ZBI = February 7, 2022, ZTIP = January 20, 2021, ZUCM = September 27, 2023.
Credit Summary

Term Summary

Visit bmo.com/etfs or contact Client Services at 1−800−361−1392.
To listen to our Views From the Desk Podcast, please visit bmoetfs.ca.
For more market insights and commentary from BMO ETFs Strategist
Bipan Rai, please visit and bookmark The Basis Point.
BMO ETF Podcasts are also available on


1 Duration: A measure of the sensitivity of the price of a fixed income investment to a change in interest rates. Duration is expressed as number of years. The price of a bond with a longer duration would be expected to rise (fall) more than the price of a bond with lower duration when interest rates fall (rise).
2 Yield Curve: A line that plots the interest rates of bonds having equal credit quality but differing maturity dates. A normal or steep yield curve indicates that long-term interest rates are higher than short-term interest rates. A flat yield curve indicates that short-term rates are in line with long-term rates, whereas an inverted yield curve indicates that short-term rates are higher than long-term rates.
3 Real Yield: the nominal yield (the stated interest rate) of a bond or other debt instrument, adjusted for inflation.
Disclaimers:
For Advisor Use Only.
The portfolio holdings are subject to change without notice and only represent a small percentage of portfolio holdings. They are not recommendations to buy or sell any particular security.
Any statement that necessarily depends on future events may be a forward-looking statement. Forward-looking statements are not guarantees of performance. They involve risks, uncertainties and assumptions. Although such statements are based on assumptions that are believed to be reasonable, there can be no assurance that actual results will not differ materially from expectations. Investors are cautioned not to rely unduly on any forward-looking statements. In connection with any forward-looking statements, investors should carefully consider the areas of risk described in the most recent prospectus.
This communication is intended for informational purposes only and is not, and should not be construed as, investment and/or tax advice to any individual. Particular investments and/or trading strategies should be evaluated relative to each individual’s circumstances. Individuals should seek the advice of professionals, as appropriate, regarding any particular investment. Investors cannot invest directly in an index.
The viewpoints expressed by the author represents their assessment of the markets at the time of publication. Those views are subject to change without notice at any time without any kind of notice. The information provided herein does not constitute a solicitation of an offer to buy, or an offer to sell securities nor should the information be relied upon as investment advice. Past performance is no guarantee of future results. This communication is intended for informational purposes only.
Commissions, management fees and expenses all may be associated with investments in exchange traded funds. Please read the ETF Facts or prospectus of the BMO ETFs before investing. The indicated rates of return are the historical annual compounded total returns including changes in unit value and reinvestment of all dividends or distributions and do not take into account sales, redemption, distribution or optional charges or income taxes payable by any unitholder that would have reduced returns. Exchange traded funds are not guaranteed, their values change frequently and past performance may not be repeated.
For a summary of the risks of an investment in the BMO ETFs, please see the specific risks set out in the BMO ETF’s prospectus. BMO ETFs trade like stocks, fluctuate in market value and may trade at a discount to their net asset value, which may increase the risk of loss. Distributions are not guaranteed and are subject to change and/or elimination.
BMO ETFs are managed by BMO Asset Management Inc., which is an investment fund manager and a portfolio manager, and a separate legal entity from Bank of Montreal.
BMO Global Asset Management is a brand name under which BMO Asset Management Inc. and BMO Investments Inc. operate.
“BMO (M-bar roundel symbol)” is a registered trademark of Bank of Montreal, used under licence.