Counter Concentration Risk with This Market Size Strategy
Oct. 23, 2024The S&P 500 is more concentrated than at any time in its near 70-year history. How can Investment Counsellors and Multi-Family Offices address this risk in their portfolios? Mark Webster, Director, Institutional & Advisory ETF Distribution presents the case for diversification by market capitalization segment — including U.S. Mid- and Small-Cap stocks.
Much has been written about the Magnificent Seven — Alphabet, Amazon, Apple, Meta, Microsoft, Nvidia, and Tesla — and the concentration risk they pose to U.S. Equity investors. Indexing, after all, is supposed to provide a diversified, objective way to invest in Equities, countering the single-security risk common to investing in company shares. How bizarre, then, that the S&P 500 is more concentrated than at any time in its history.1 Where is the diversification?
As dramatic as the coverage may be, index concentration is not unique to U.S. Equities, nor is this the first-time concentration risks have garnered headlines. A simple search for the words “herding” and “markets” shows there have been several periods where herding or concentration risk has been widely discussed. The most obvious was during the Tech Bubble at the turn of the millennium, when there was a nasty outcome. In fairness, the ‘bubble burst’ was exacerbated a year later by 9/11 and then by corporate malfeasance by companies like Enron, WorldCom, and Tyco, neither of which had anything to do with market concentration. Herding was also broadly discussed in 2016, without any corresponding events to justify the worry.
Should investors be concerned about concentration risk in U.S. Equities?
Concentration risk — like any other risk — must be evaluated to gauge its materiality, and proper context is required.
Firstly, concentration is a consequence of a market capitalization index that implicitly captures the Momentum factor. By definition, such an index will register or record capital flows, up and down, weighting companies according to their fortunes. Companies with appreciating share prices earn a greater presence in the index while those with declining prices are marginalized.
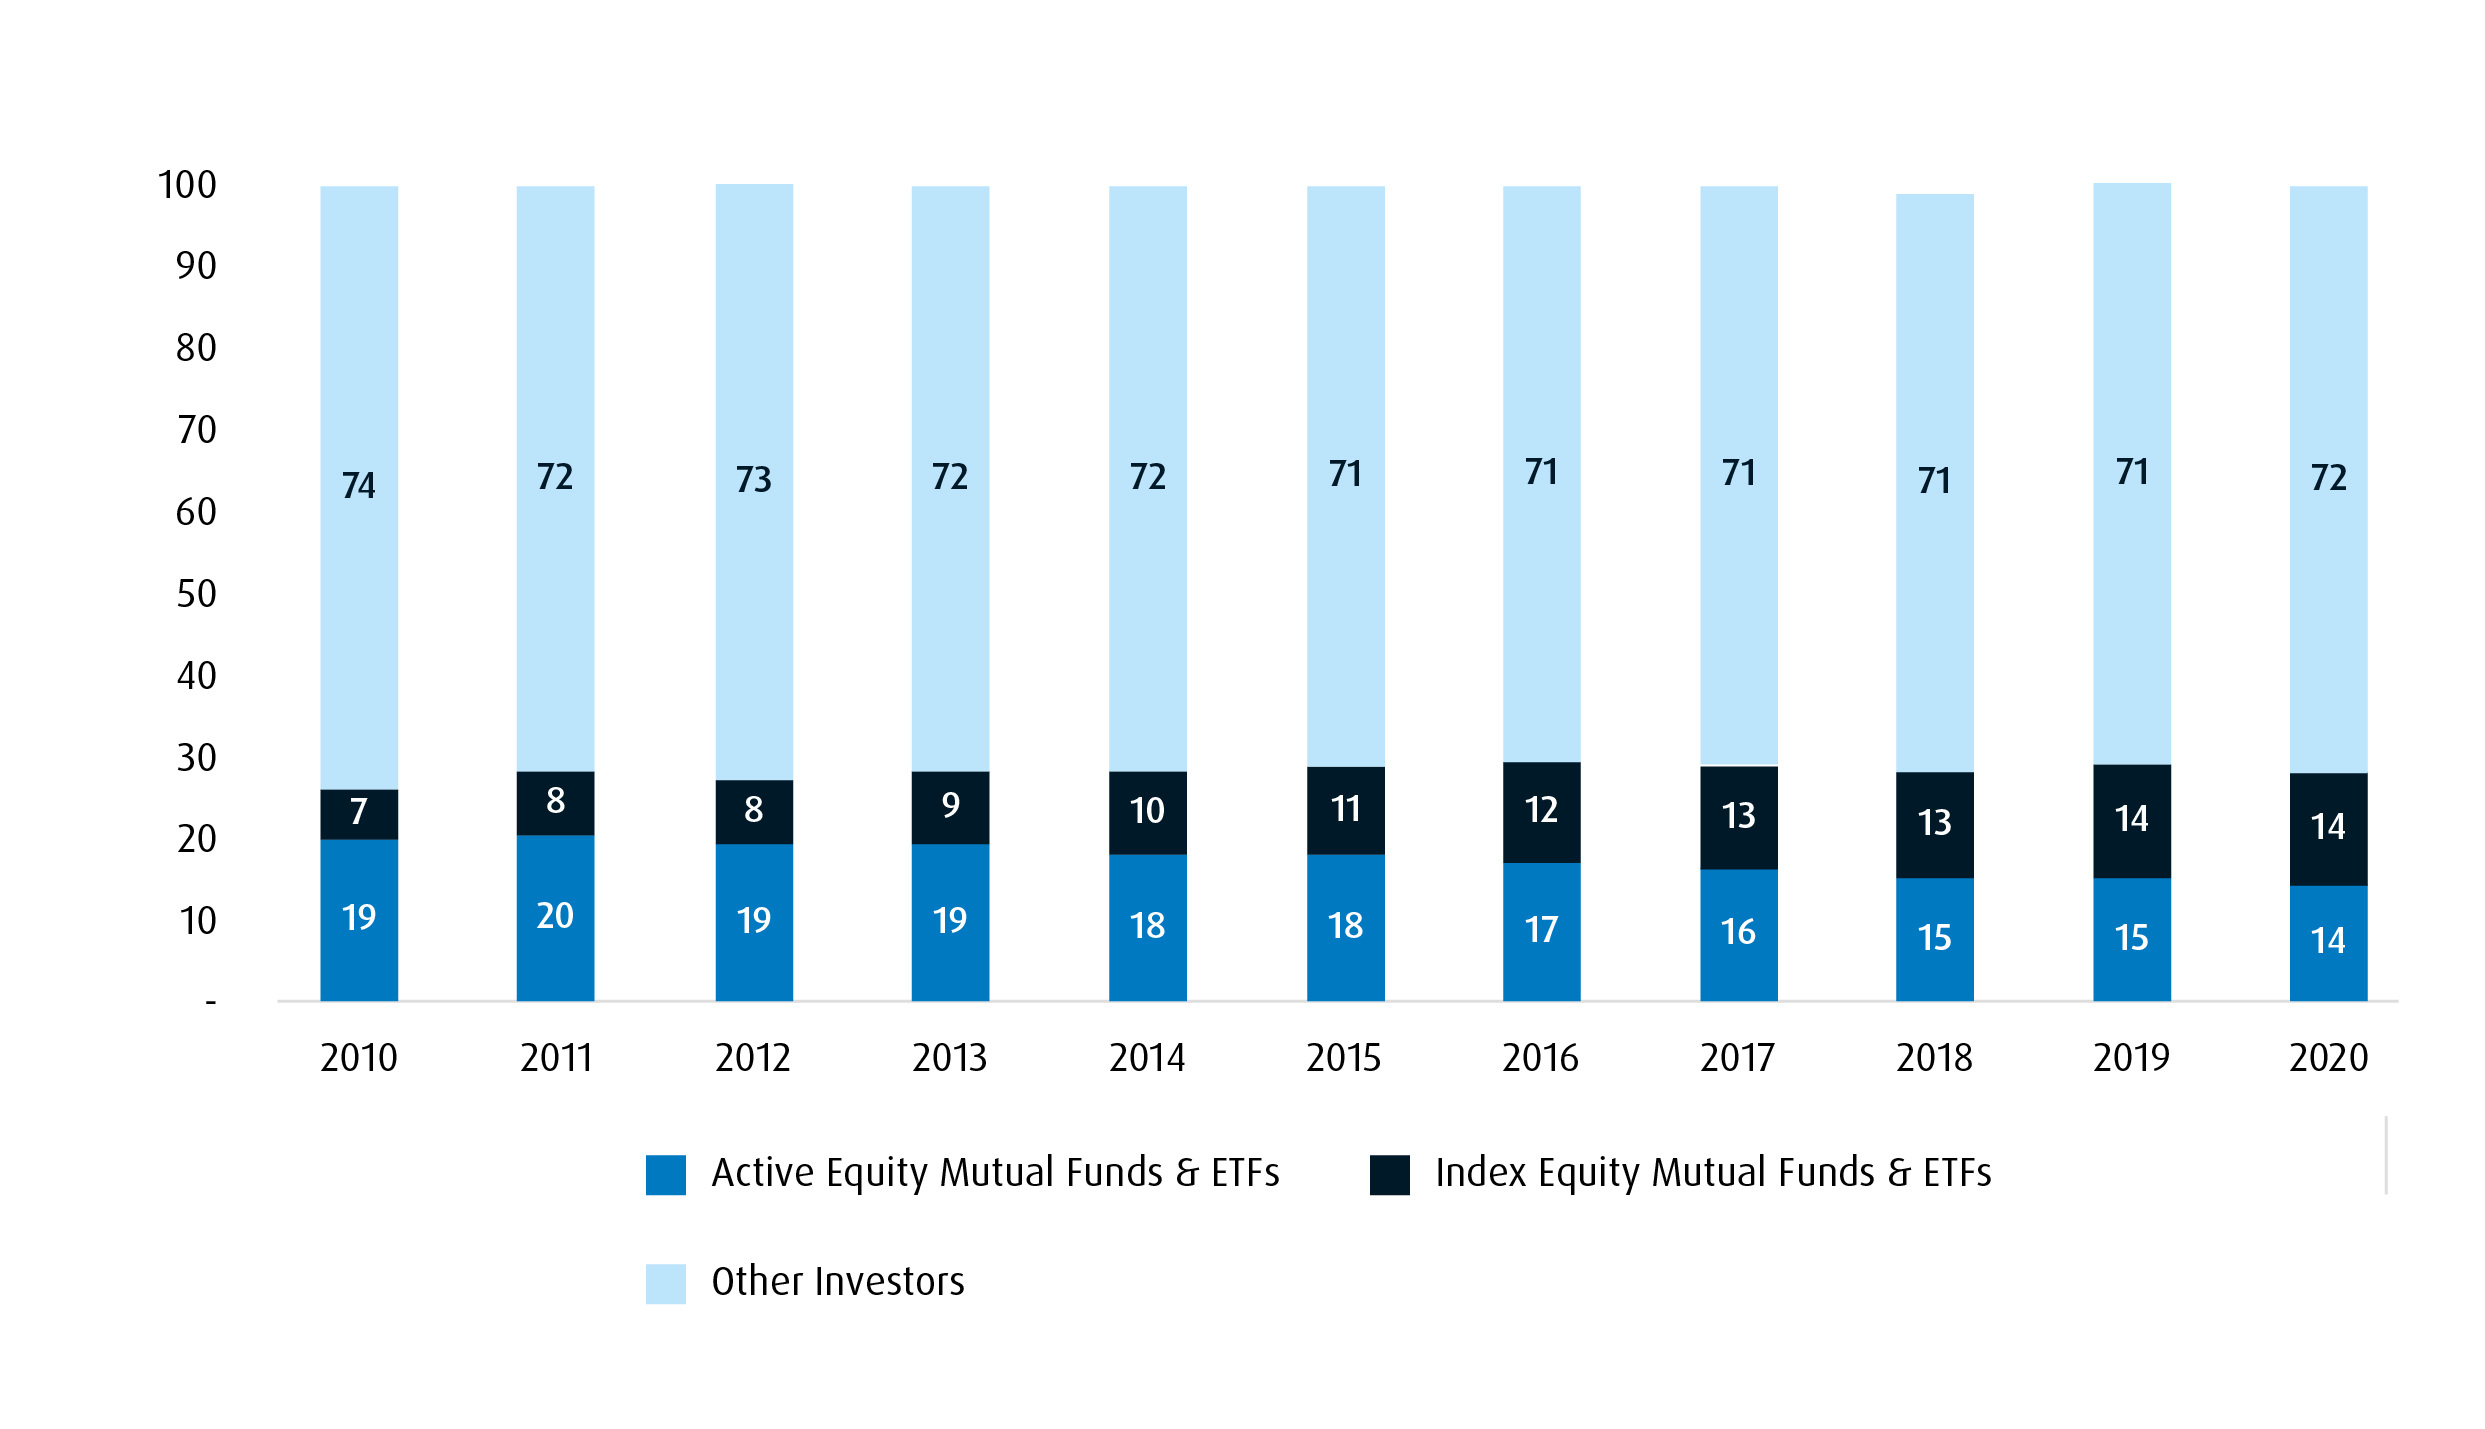
Some may suggest this is due to the growth in indexing, but that criticism fails under scrutiny. Indexing, be it through ETFs or index funds, may confirm prices, but active managers’ activities set them higher or lower. As these National Bank graphics so exquisitely demonstrate, indexing is the tail on the dog:
Passive Is Not Massive: Percentage of U.S. Stock Market Capitalization
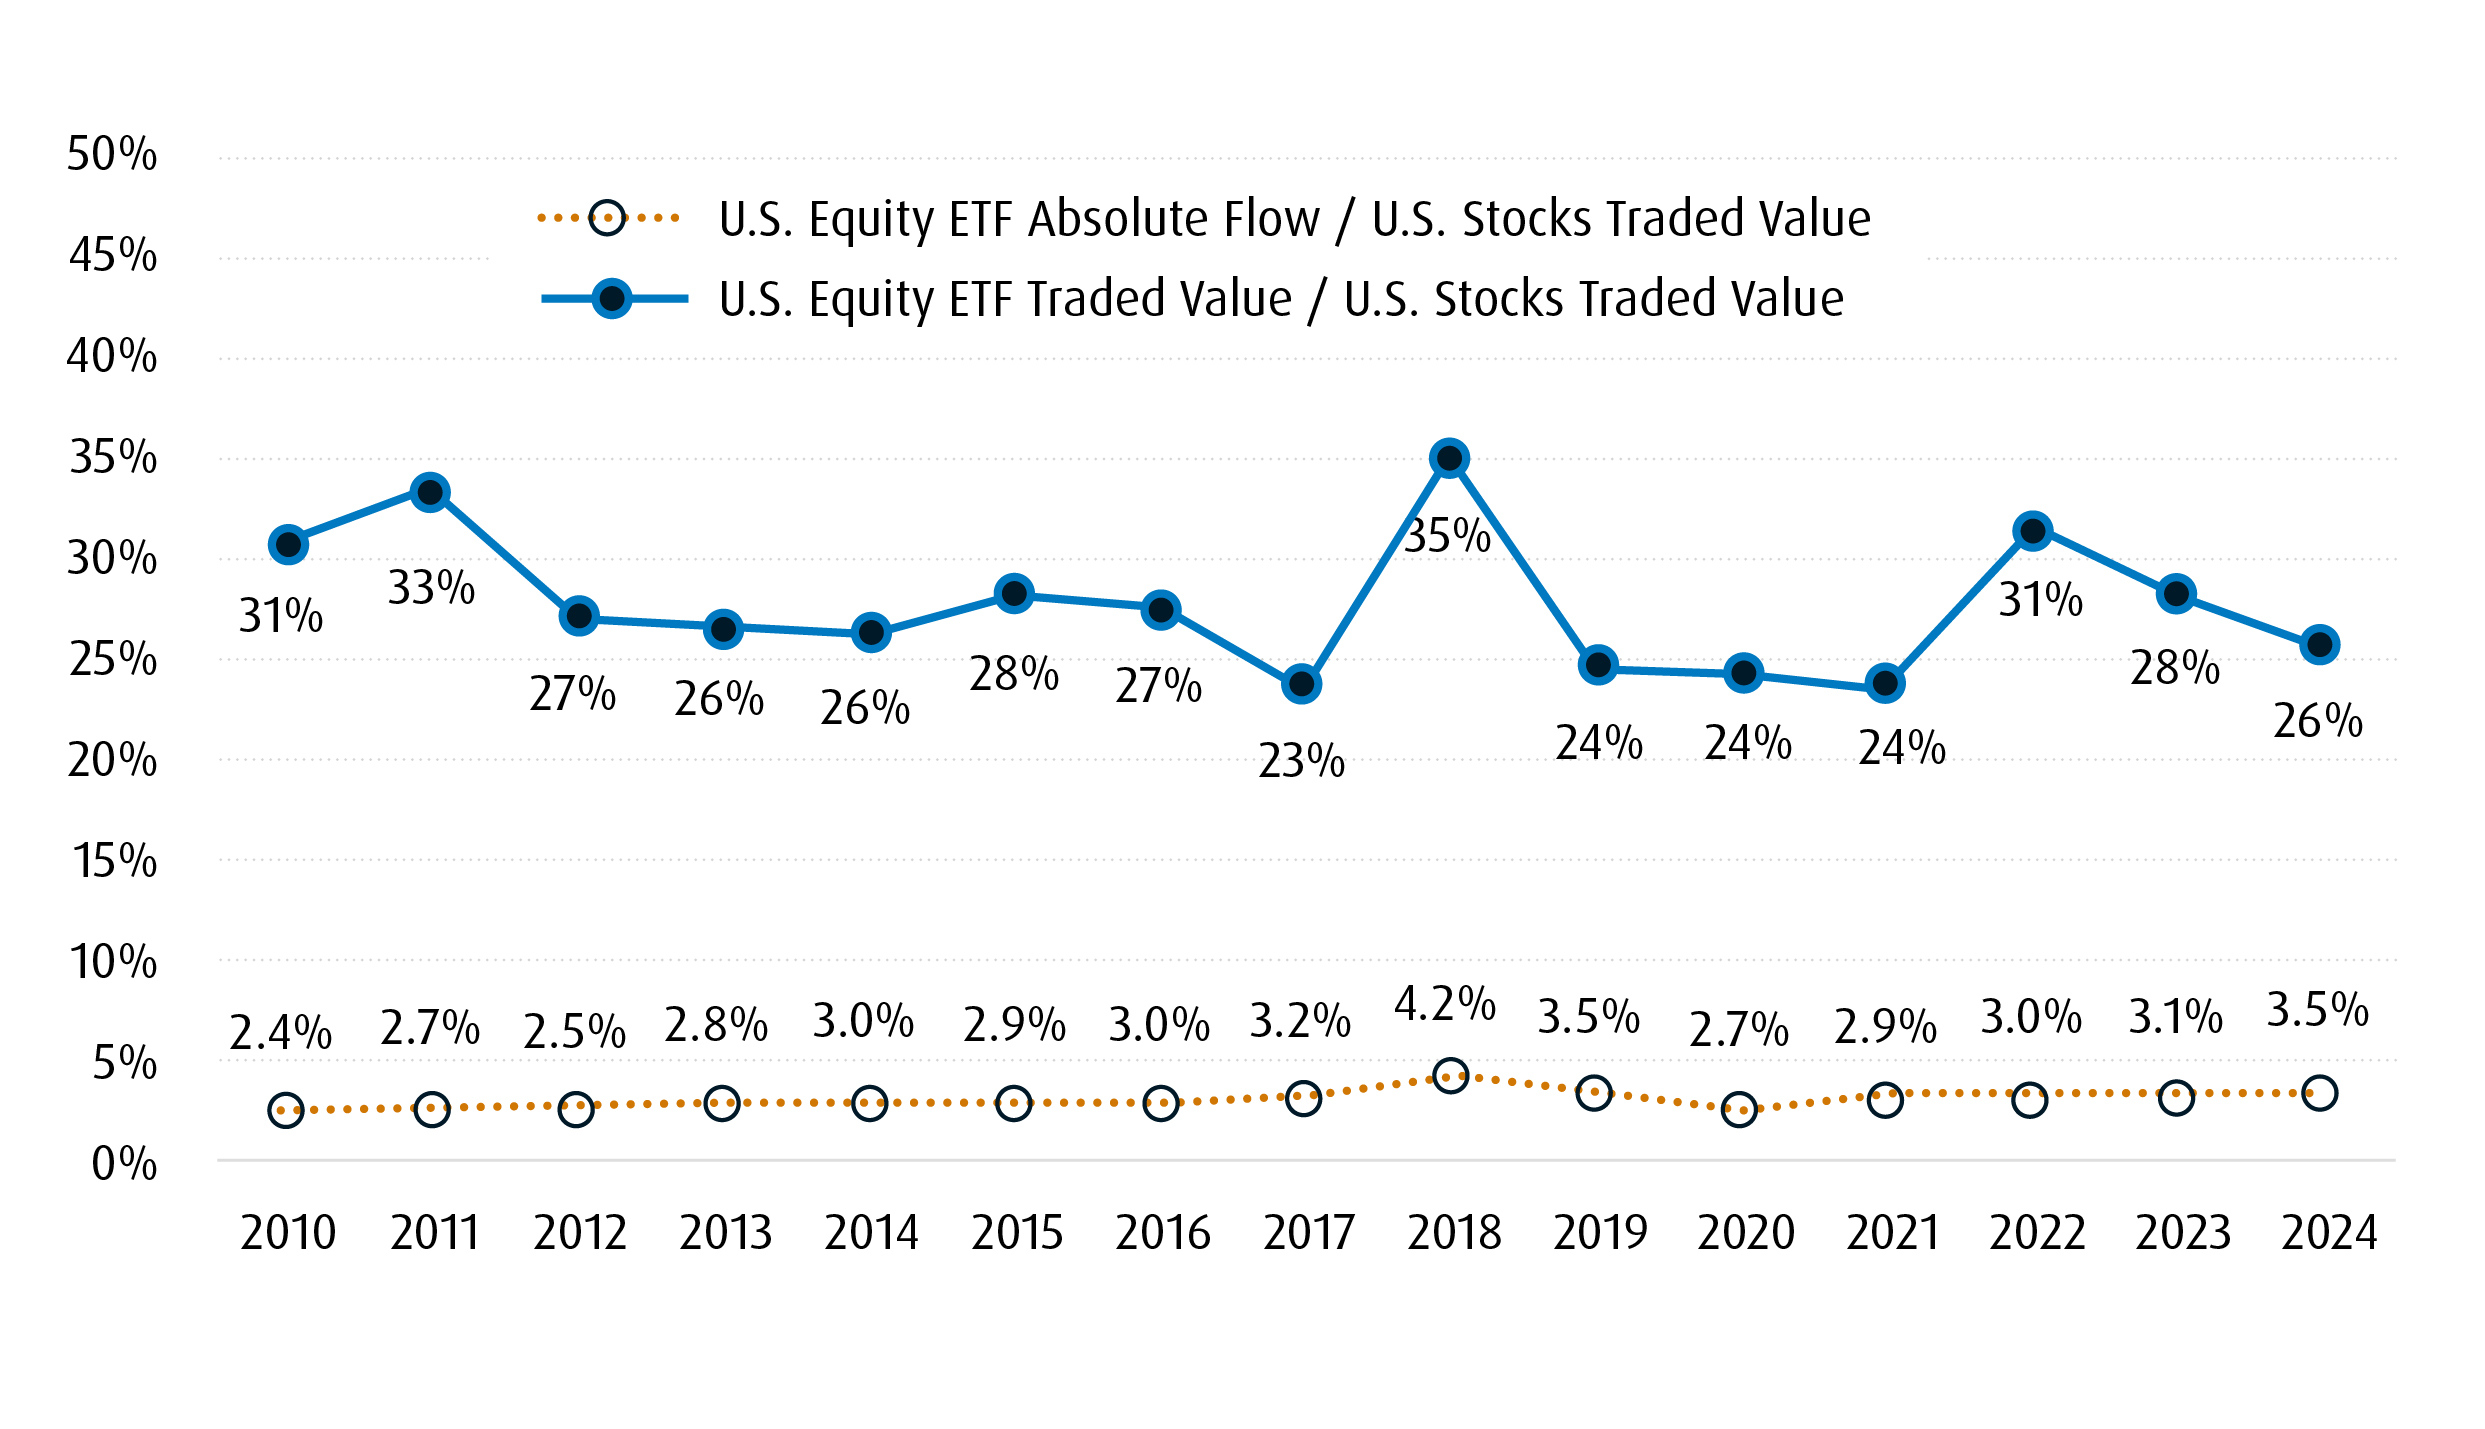
The chart below is critical to understand the imprint ETFs have made on the market. Because an ETF trades directly from seller to buyer across Exchanges — without trading the underlying securities — its imprint on price is fractional. As the chart demonstrates, only 3.5% of ETF trades in U.S. Equities are Creation/Redemption trades, where securities are bought or sold, leaving a market imprint.
U.S. Equity ETF Trading Impact
Nonetheless, concentration still requires some context. Yes, the S&P 500 has elevated concentration levels but, in comparison to other traditional markets, it is less severe:
| S&P 500 | |
| APPLE INC | 6.99% |
| MICROSOFT CORP | 6.74% |
| NVIDIA CORP | 5.98% |
| AMAZON .COM INC | 3.40% |
| META PLATFORMS INC | 2.52% |
| ALPHABET INC | 2.12% |
| ALPHABET INC | 1.79% |
| BERKSHIRE HATHAWAY INC | 1.74% |
| ELI LILLY & CO | 1.57% |
| BROADCOM INC | 1.44.% |
| TOTAL | 34.29% |
| S&P/TSX 60 | |
| ROYAL BANK OF CANADA | 8.13% |
| TORONTO-DOMINION BANK/THE | 5.37% |
| ENBRIDGE INC | 4.40% |
| SHOPIFY INC | 4.38% |
| CANADIAN NATURAL RESOURCES LTD | 4.06% |
| CANADIAN PACIFIC KANSAS CITY LTD | 3.82% |
| CANADIAN NATIONAL RAILWAY CO | 3.36% |
| BROOKFIELD CORP | 3.35% |
| BANK OF MONTREAL | 3.15% |
| CONSTELLATION SOFTWARE INC/CANADA | 3.02% |
| TOTAL | 43.04% |
S&P/TSX Composite |
|
| ROYAL BANK OF CANADA | 6.55% |
| TORONTO-DOMINION BANK/THE | 4.33% |
| ENBRIDGE INC | 3.55% |
| SHOPIFY INC | 3.53% |
| CANADIAN NATURAL RESOURCES LTD | 3.27% |
| CANADIAN PACIFIC KANSAS CITY LTD | 3.09% |
| CANADIAN NATIONAL RAILWAY CO | 2.71% |
| BROOKFIELD CORP | 2.71% |
| BANK OF MONTREAL | 2.53% |
| CONSTELLATION SOFTWARE INC/CANADA | 2.43% |
| TOTAL | 34.7% |
Japan |
|
| TOYOTA MOTOR CORP | 4.66% |
| MITSUBISHI UFJ FINANCIAL GROUP INC | 2.75% |
| SONY GROUP CORP | 2.57% |
| HITACHILTD | 2.51% |
| RECRUIT HOLDINGS CO LTD | 2.14% |
| SHIN-ETSU CHEMICAL CO LTD | 2.03% |
| TOKYO ELECTRON LTD | 2.00% |
| SUMITOMO MITSUI FINANCIAL GROUP INC | 2.00% |
| KEYENCE CORP | 1.88% |
| DAIICHI SANKYO CO LTD | 1.77% |
| TOTAL | 24.31% |
Canada Corporate Bond Index |
|
TORONTO-DOMINION BANK/THE |
5.82% |
ROYAL BANK OF CANADA |
5.54% |
BANK OF MONTREAL |
4.32% |
BANK OF NOVA SCOTIA |
3.66% |
CIBC |
3.28% |
BELL CANADA |
3.13% |
TRANSCANADA PIPELINES |
2.95% |
TELUS |
2.92% |
ROGERS COMMUNICATIONS |
2.88% |
ENBRIDGE |
2.70% |
| TOTAL | 37.20% |
Source: BMO Global Asset Management, as at September 30, 2024.
Furthermore, concentration occurs because performance has been extremely robust, though not broad-based. To be clear: concentration has brought rewards that would not have been achieved through a different weighting methodology.
Two Ways to Address Concentration Risk
There are two possible remedies for those who want to diversify as a means of reducing concentration risk. The first appears to be the simplest: to employ an equal weighting methodology to be more egalitarian. The other approach would be to diversify by market capitalization segment, wading into Mid and Small Caps.
People often discuss the Equal Weight S&P 500 as an easy way to embrace the Size factor, shedding the market capitalization weighting to get more breadth in the exposure. While this is true, we cannot escape the fact that all the names are, by definition, Large- and Mega-Cap stocks, so the Size factor benefit is really quite muted.
Diversification away from concentration and by capitalization is desirable but it may be better achieved by using the S&P 400 (ZMID – BMO S&P US Mid Cap Index ETF) and S&P 600 (ZSML – BMO S&P US Small Cap Index ETF) to get defined exposure to these important market segments.
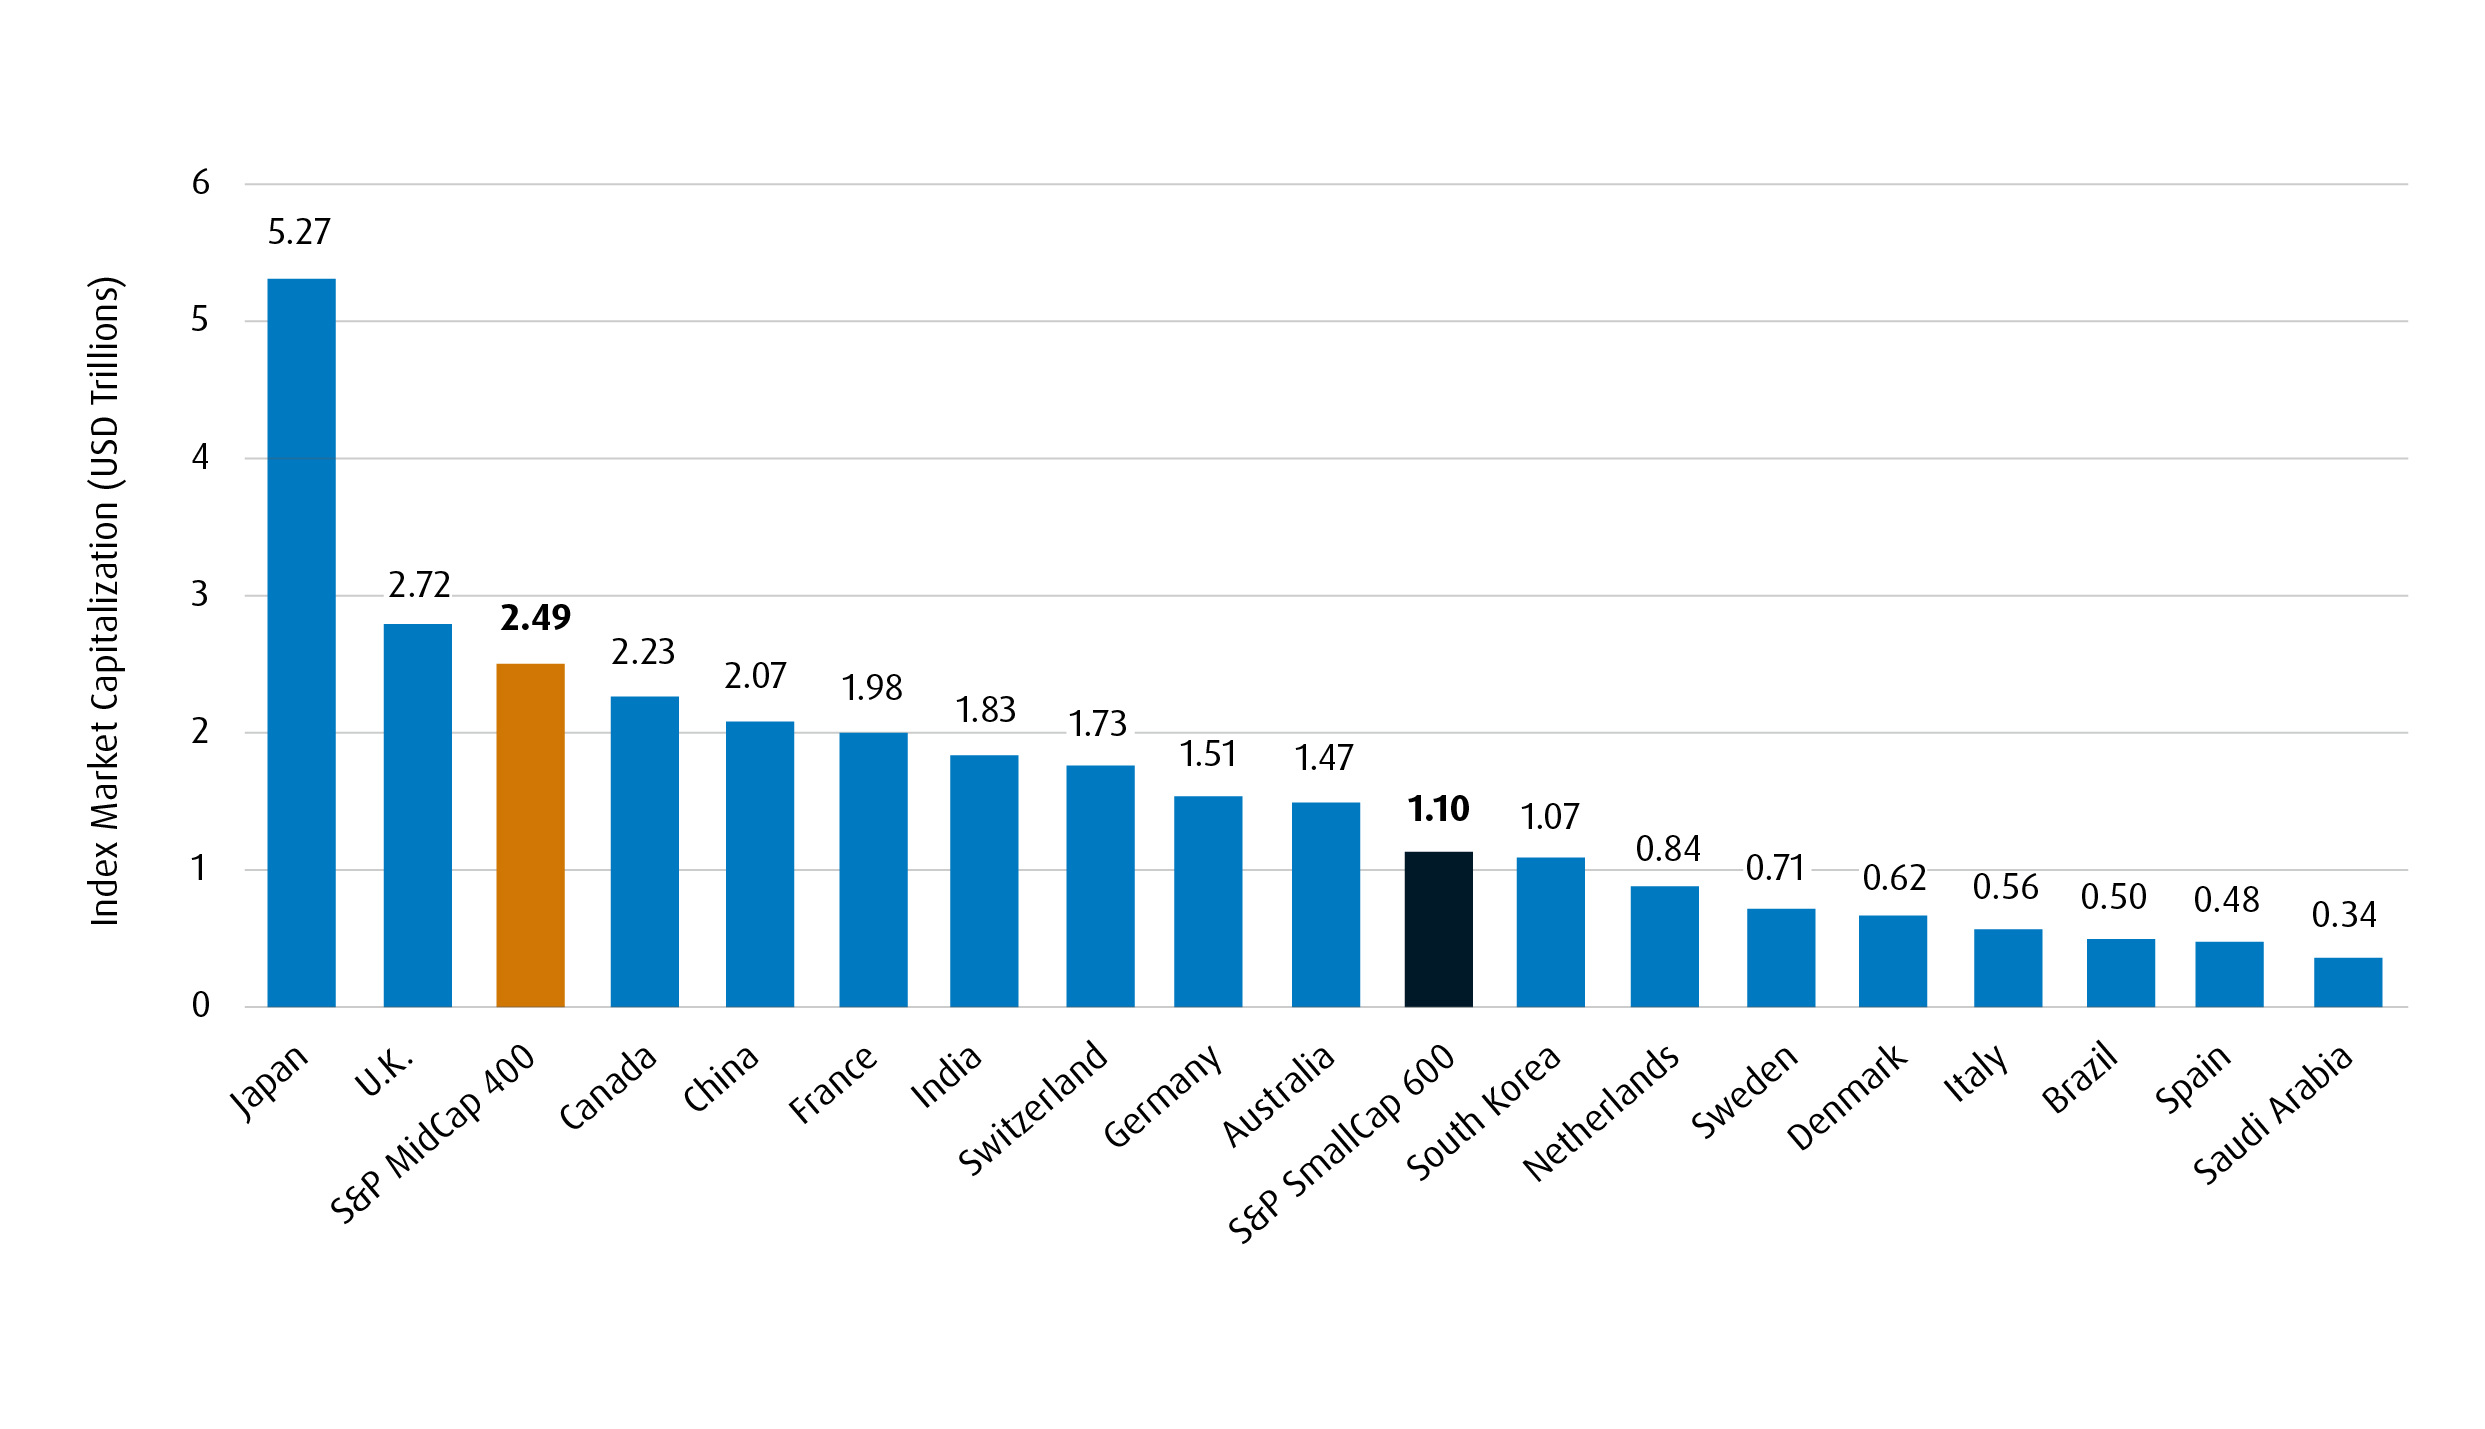
Investors may overlook the capital market significance both segments warrant. U.S. Mid Caps provide a more robust data set than the entire Canadian market — or France and Germany, for that matter — while U.S. Small Caps offer a broader opportunity set than South Korea, Italy, Brazil or Spain.
The S&P MidCap 400 and the S&P SmallCap 600 Are Larger Than Canada and South Korea, Respectively
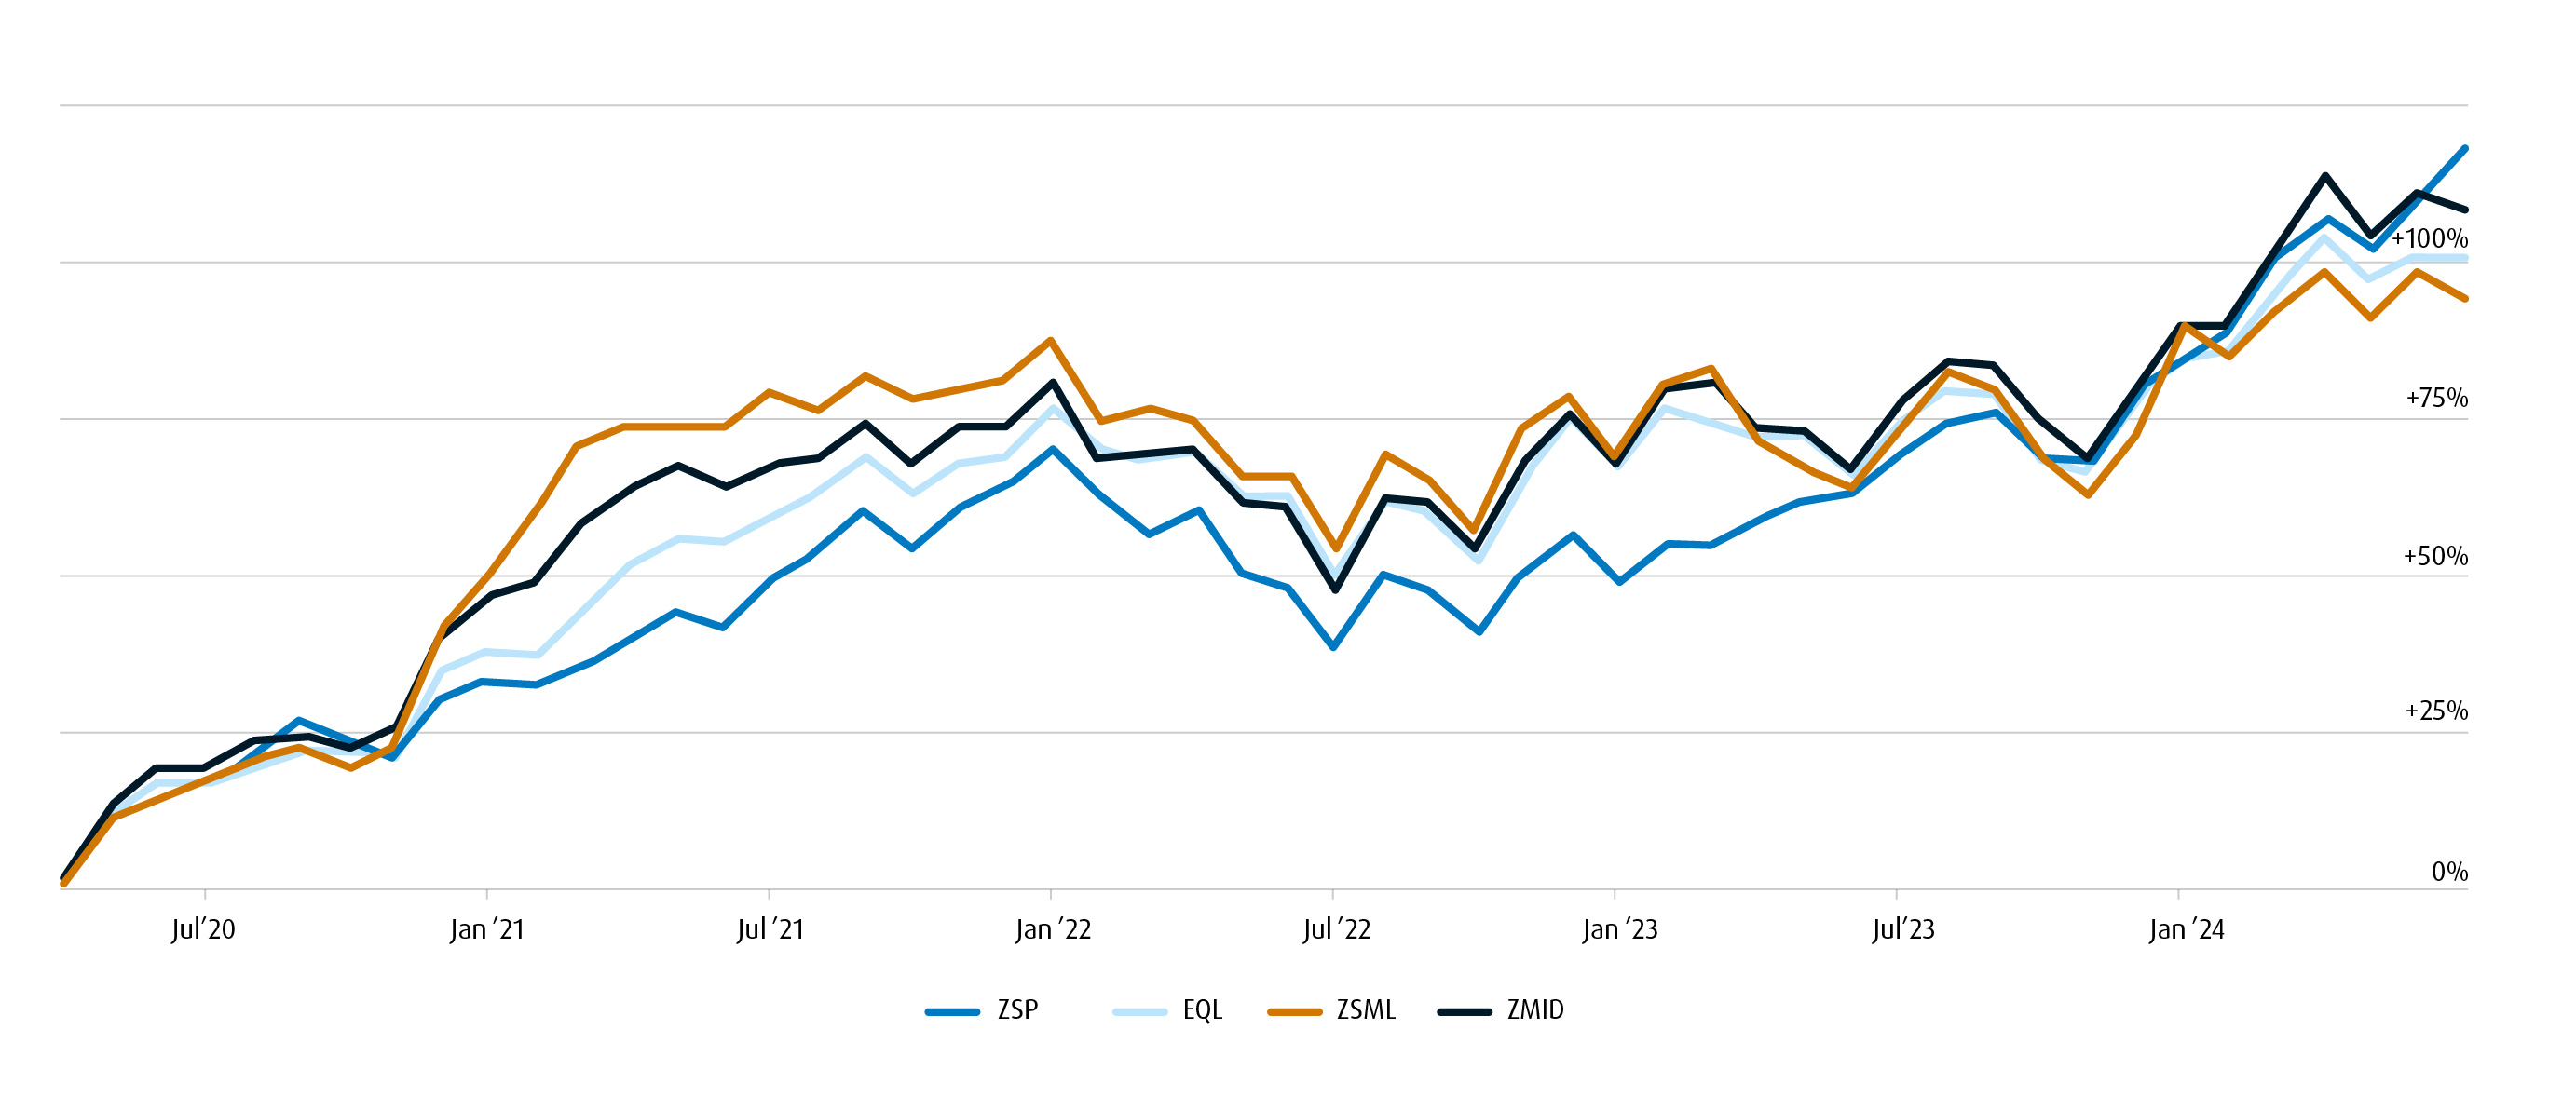
Over the last few years, focused exposure to Mid and Small Caps has been more productive than using an equal-weight Large-Cap approach:
Performance: ZSP (BMO S&P 500 Index ETF) vs. EQL (Invesco S&P 500 Equal Weight Index ETF CAD) vs. ZSML vs. ZMID
Fund Performance
1- Month |
3-Month |
6- Month |
Year-to-Date |
1-Year |
3-Year |
5-Year |
10-Year |
Since Inception |
Inception Date |
|
2.48% |
4.59% |
10.08% |
24.32% |
35.28% |
13.99% |
16.07% |
15.10% |
17.53% |
November 14, 2012 |
|
EQL |
2.43% |
7.99% |
6.27% |
17.41% |
27.89% |
9.91% |
12.69% |
- |
11.79% |
May 29, 2018 |
1.17% |
8.72% |
6.30% |
11.27% |
24.76% |
5.80% |
- |
- |
9.06% |
February 5, 2020 |
|
1.46% |
5.60% |
2.89% |
15.54% |
25.75% |
9.37% |
- |
- |
10.81% |
February 5, 2020 |
Annualized performance. Source: BMO Global Asset Management, Invesco, as of September 30, 2024. Note: ZSP and EQL both invest in companies listed on the S&P 500 Index. EQL attempts to address concentration risk by employing an equal-weight allocation strategy, while ZSP maintains a market capitalization approach. Investors seeking an alternate diversification method can employ ZSML and ZMID as complements to ZSP in order to offset the latter’s weightings to large and mega-cap equities and provide a return enhancement. The chart above shows the performance of all four of the above ETFs since inception. See disclaimer below.*
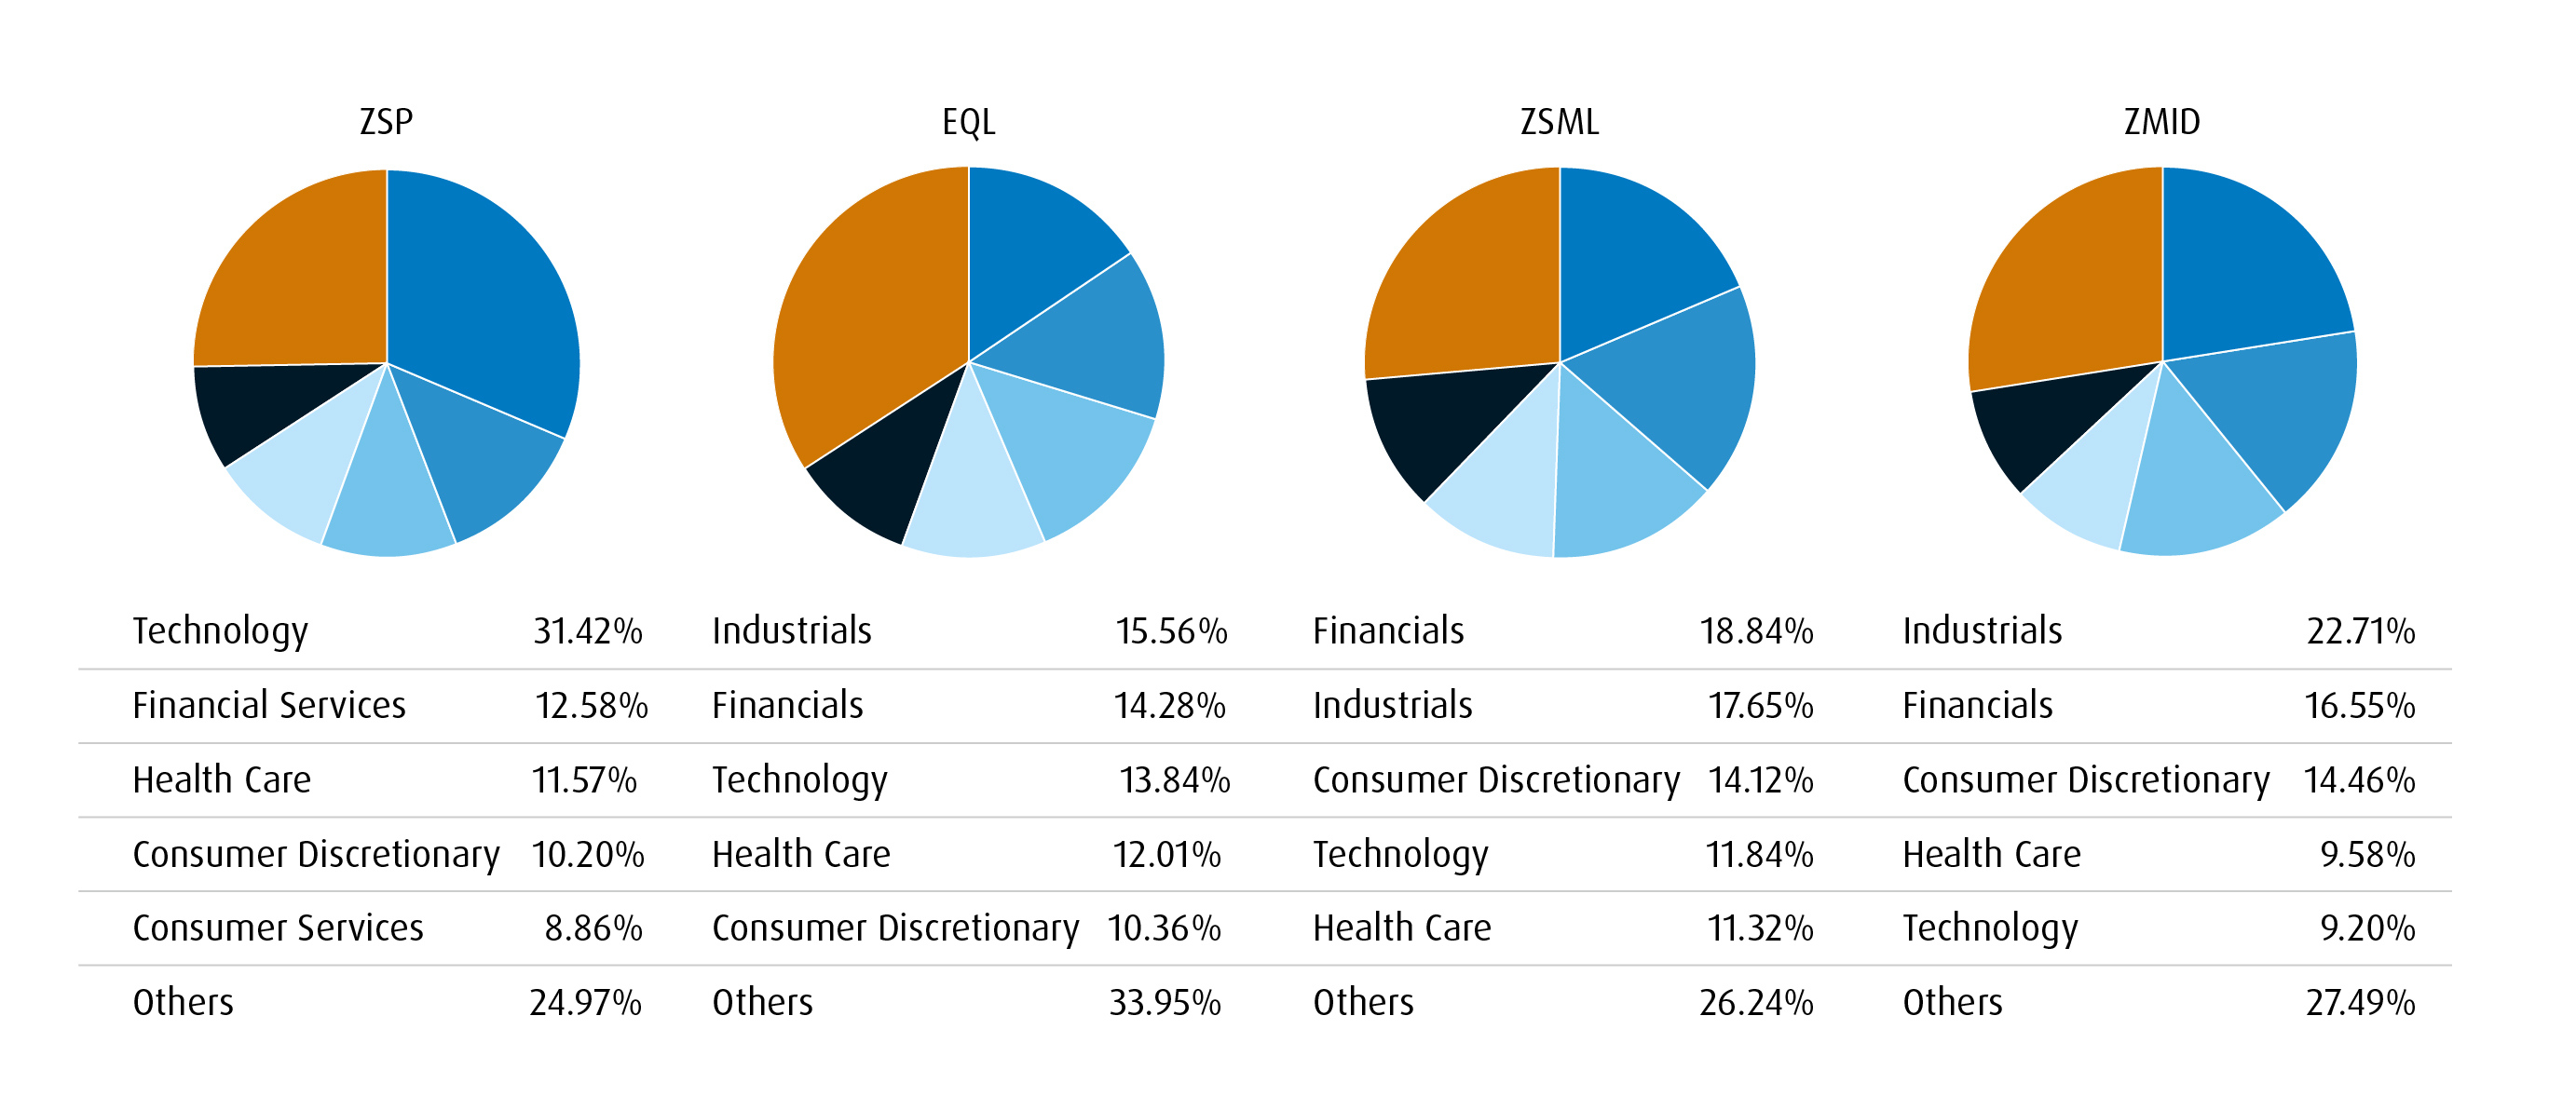
Asset allocators can exert more control by managing Large-, Mid- and Small-Cap components separately, providing a more sophisticated and deliberate portfolio to their clients. As these pie charts clearly show, there is greater sector diversification in harnessing Mid- and Small-Caps than can be had by implementing an equal weight Large-Cap solution:
Sector Allocation: ZSP vs. EQL vs. ZSML vs. ZMID
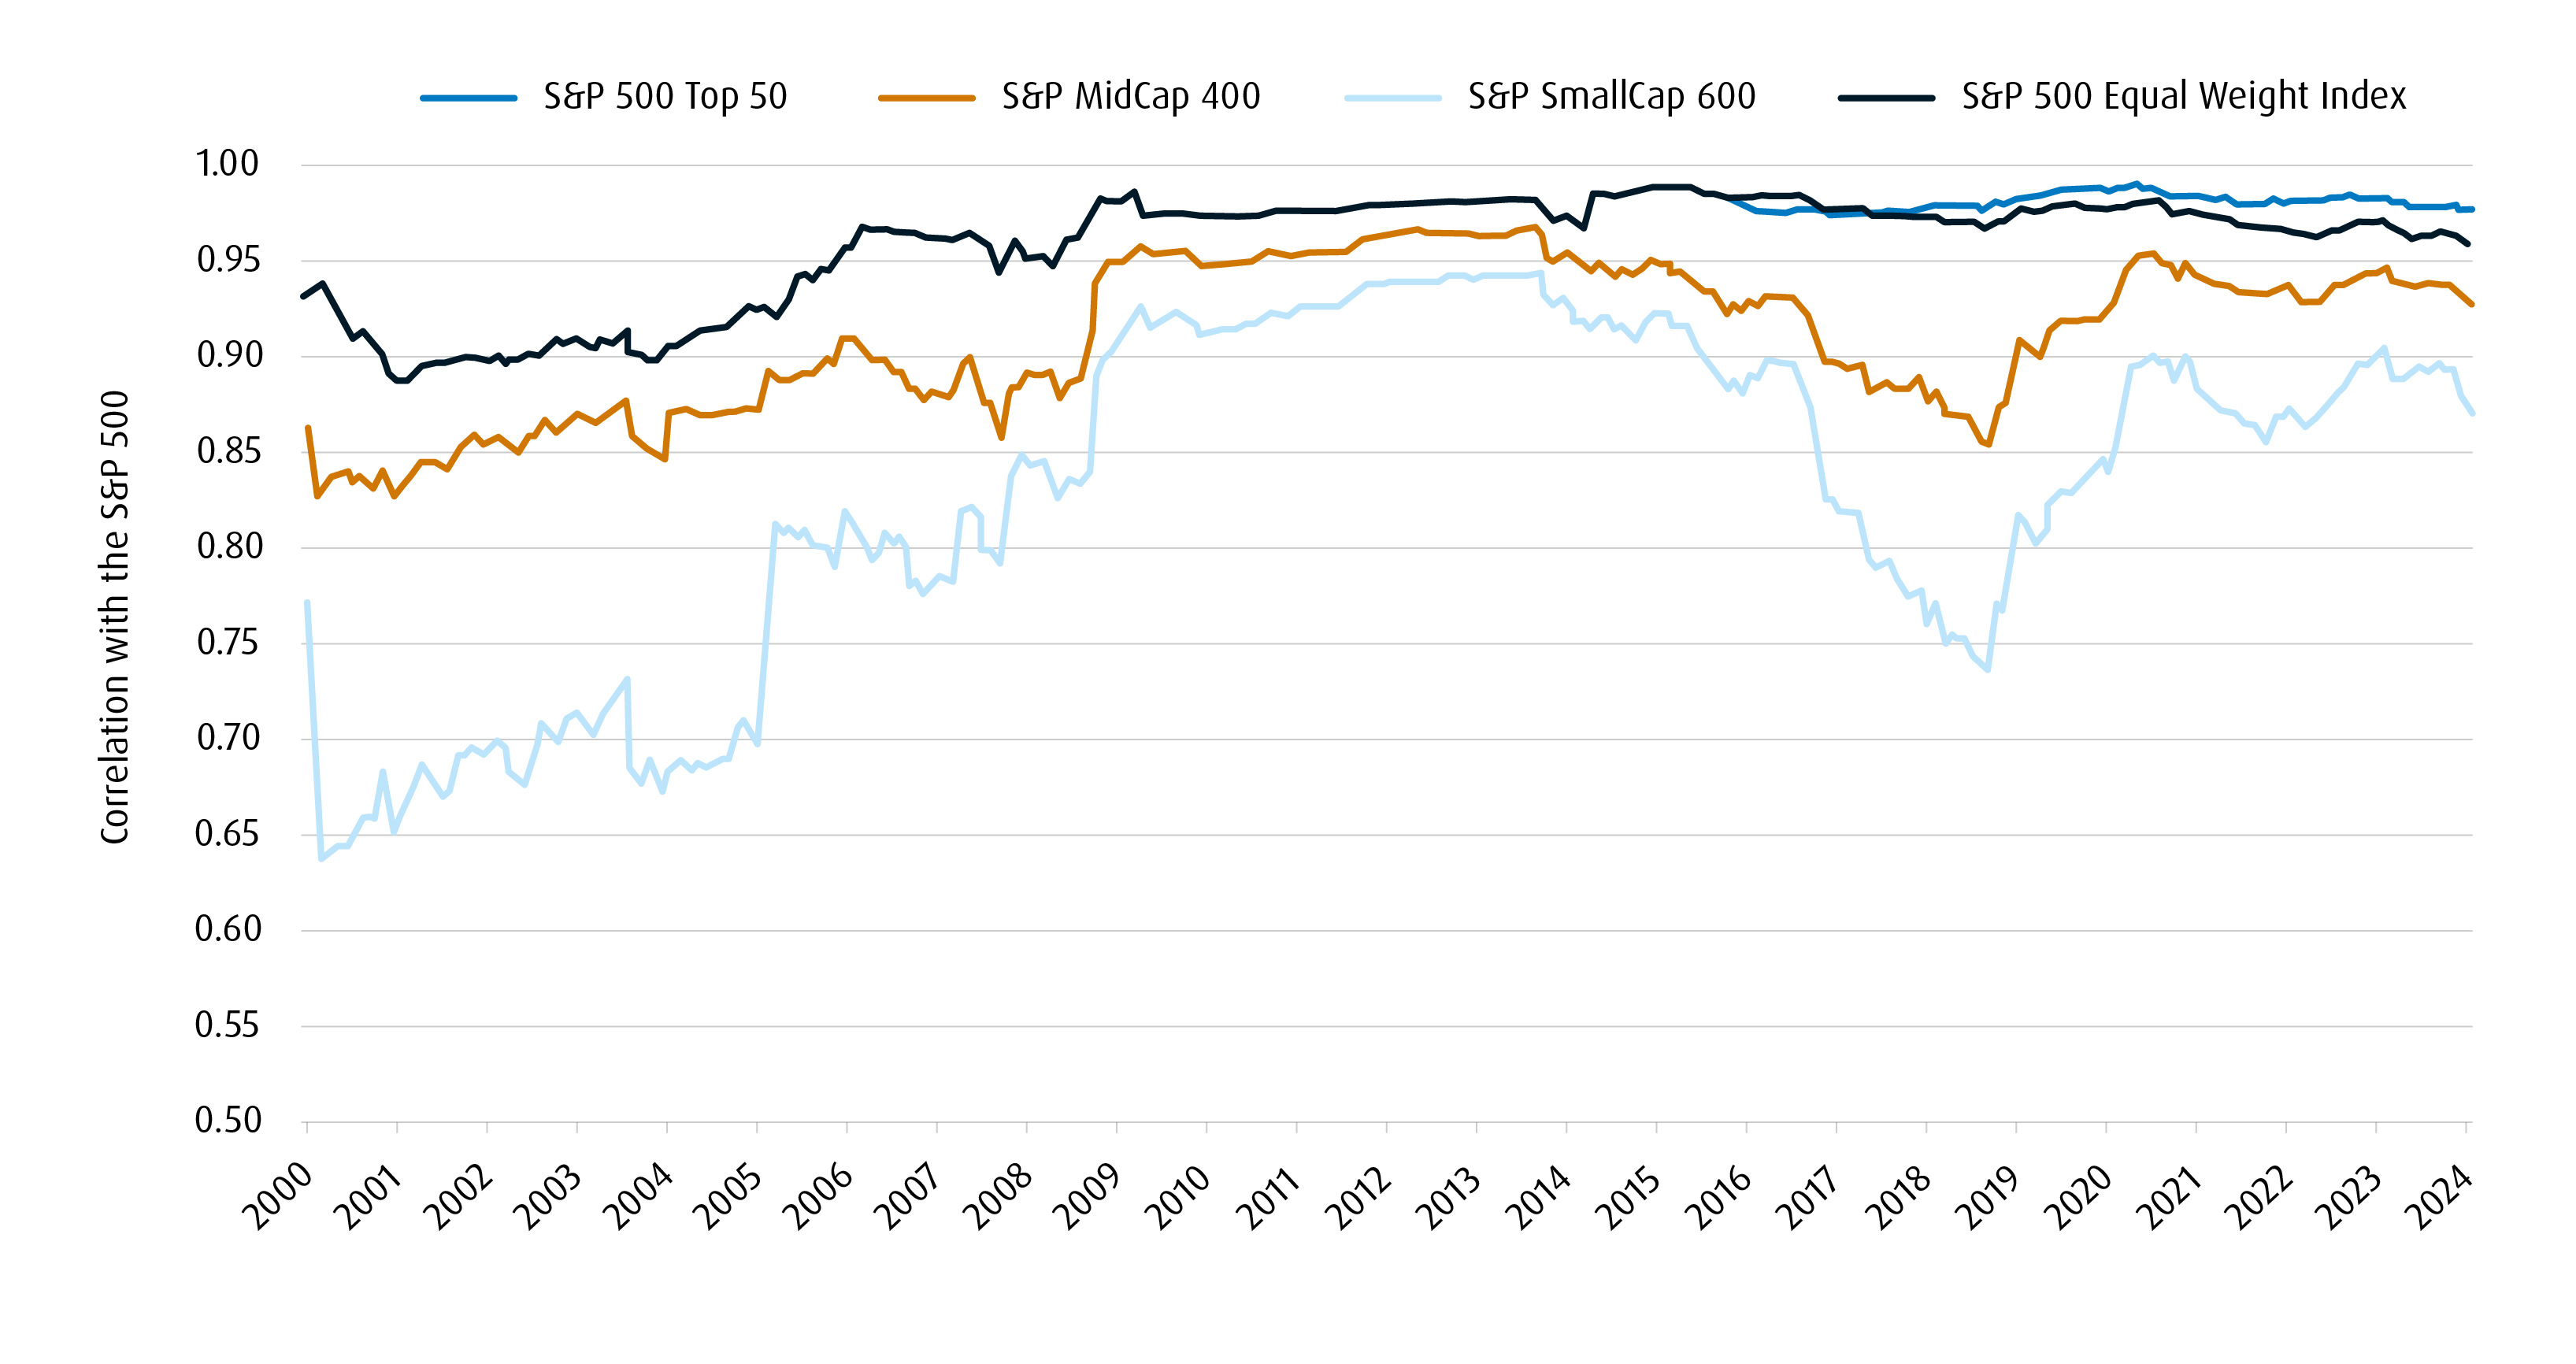
The most compelling reason to consider adding Small- and Mid-Cap exposure to a U.S. Equity allocation is the relatively low correlation they have to U.S. Large- and Mega-Cap stocks. Only very modest correlation benefits are achieved using an equal weight Large-Cap approach, but Small- and Mid-Cap names provide much greater advantages, and thus may be far better portfolio construction tools:
Rolling 5-Year Correlation of Monthly Returns with the S&P 500
Conclusion
In summation, concentration is a cyclical phenomenon which does have some demonstrable benefits. The Magnificent Seven have certainly provided the heavy lifting to raise the index while other index constituents have been quiet. Investors have benefitted.
If investors want to manage concentration risk, it may be preferable to do so by broadening their data set rather than merely reweighting it. This brings not only greater sector diversification but also access to an entirely different capital segment, greatly enhancing portfolio construction.
To learn more about BMO’s suite of ESG ETFs or receive other trading insights, reach out to your BMO ETF Specialist at their email address or via telephone at 1−877−741−7263.
Disclaimers
For Advisor and institutional use only.
Any statement that necessarily depends on future events may be a forward-looking statement. Forward-looking statements are not guarantees of performance. They involve risks, uncertainties and assumptions. Although such statements are based on assumptions that are believed to be reasonable, there can be no assurance that actual results will not differ materially from expectations. Investors are cautioned not to rely unduly on any forward-looking statements. In connection with any forward-looking statements, investors should carefully consider the areas of risk described in the most recent prospectus.
The viewpoints expressed by the authors represents their assessment of the markets at the time of publication. Those views are subject to change without notice at any time without any kind of notice. The information provided herein does not constitute a solicitation of an offer to buy, or an offer to sell securities nor should the information be relied upon as investment advice. Past performance is no guarantee of future results. The statistics in this update are based on information believed to be reliable but not guaranteed.
This article is for information purposes. The information contained herein is not, and should not be construed as, investment, tax or legal advice to any party. Particular investments and/or trading strategies should be evaluated relative to the individual’s investment objectives and professional advice should be obtained with respect to any circumstance.
This article may contain links to other sites that BMO Global Asset Management does not own or operate.
Any content from or links to a third-party website are not reviewed or endorsed by us. You use any external websites or third-party content at your own risk. Accordingly, we disclaim any responsibility for them.
Index returns do not reflect transactions costs or the deduction of other fees and expenses and it is not possible to invest directly in an Index. The performance of an Index fund is expected to be lower than the performance of its respective index. Comparisons to indices have limitations because indices have volatility and other material characteristics that may differ from a particular mutual fund or ETF.
The Index is a product of S&P Dow Jones Indices LLC or its affiliates (“SPDJI”), and has been licensed for use by the Manager. S&P®, S&P 500®, US 500, The 500, iBoxx®, iTraxx® and CDX® are trademarks of S&P Global, Inc. or its affiliates (“S&P”) and Dow Jones® is a registered trademark of Dow Jones Trademark Holdings LLC (“Dow Jones”), and these trademarks have been licensed for use by SPDJI and sublicensed for certain purposes by the Manager. The ETF is not sponsored, endorsed, sold or promoted by SPDJI, Dow Jones, S&P, their respective affiliates, and none of such parties make any representation regarding the advisability of investing in such product(s) nor do they have any liability for any errors, omissions, or interruptions of the Index.
*The comparison presented is intended to illustrate the historical performance of the BMO S&P 500 Index ETF (ZSP), BMO S&P US Small Cap Index ETF (ZSML), and BMO S&P US Mid Cap Index ETF (ZMID) as compared with the historical performance of the Invesco S&P 500 Equal Weight Index ETF CAD (EQL). There are various differences that may exist between ZSP, ZSML, ZMID, and EQL that may affect the performance of each. The objectives and strategies of ZSP, ZSML, and ZMID result in holdings that do not necessarily reflect the constituents and weightings within EQL.
The portfolio holdings are subject to change without notice and only represent a small percentage of portfolio holdings. They are not recommendations to buy or sell any particular security.
Commissions, management fees and expenses all may be associated with investments in exchange traded funds. Please read the ETF Facts or prospectus of the BMO ETFs before investing. The indicated rates of return are the historical annual compounded total returns including changes in unit value and reinvestment of all dividends or distributions and do not take into account sales, redemption, distribution or optional charges or income taxes payable by any unitholder that would have reduced returns. Exchange traded funds are not guaranteed, their values change frequently and past performance may not be repeated.
For a summary of the risks of an investment in the BMO ETFs, please see the specific risks set out in the BMO ETF’s prospectus. BMO ETFs trade like stocks, fluctuate in market value and may trade at a discount to their net asset value, which may increase the risk of loss. Distributions are not guaranteed and are subject to change and/or elimination.
BMO ETFs are managed by BMO Asset Management Inc., which is an investment fund manager and a portfolio manager, and a separate legal entity from Bank of Montreal.
BMO Global Asset Management is a brand name under which BMO Asset Management Inc. and BMO Investments Inc. operate.
“BMO (M-bar roundel symbol)” is a registered trademark of Bank of Montreal, used under licence.