Factors in Focus: Targeting Maximum Inflation Protection
With inflation running hot, investment counselors and family offices may want to re-assess their portfolio’s factor tilts. To this end, Erika Toth, Director, Institutional & Advisory, BMO ETFs, offers insights into how factors perform across different interest rate regimes and market cycles.
Apr. 19, 2022Factors and active returns
In 2009, on the heels of the Great Financial Crisis, an interesting study was published about the Government Pension Fund of Norway that found, “approximately 70% of all active returns on the overall fund can be explained by exposures to systematic factors.”1 The effectiveness of factors has become more widely recognized during the 13 years since this research was published, with new data and studies emerging on an ongoing basis.
The industry kept pace as well — MSCI, in particular, has done compelling research on the behaviour of factors across four different economic and interest rate scenarios.
My colleague, Laura Tase, provided an overview of these equity factors in a previous article, titled Factors: Separating the Wheat from the Chaff. In this edition of VAULT, we will go a step further to discuss factor performance across multiple interest rate and inflation scenarios, with the goal of providing a clearer process for evaluating the factor tilts in your investment portfolios.
Rate hikes: two potential economic regimes
Milton Friedman once said that “Inflation is always and everywhere a monetary phenomenon.” Whether you agree or not, investors are clearly concerned at present about high inflation and central bank attempts to bring the price growth under control. These macro risks have also been compounded by geopolitical tensions that unfortunately devolved into war in Eastern Europe. In addition to the humanitarian toll, which is significant, the Russia-Ukraine war will likely ramp up production costs, commodity prices and ongoing supply chain issues. All this adds pressure on manufacturers to pass through costs to the consumer.
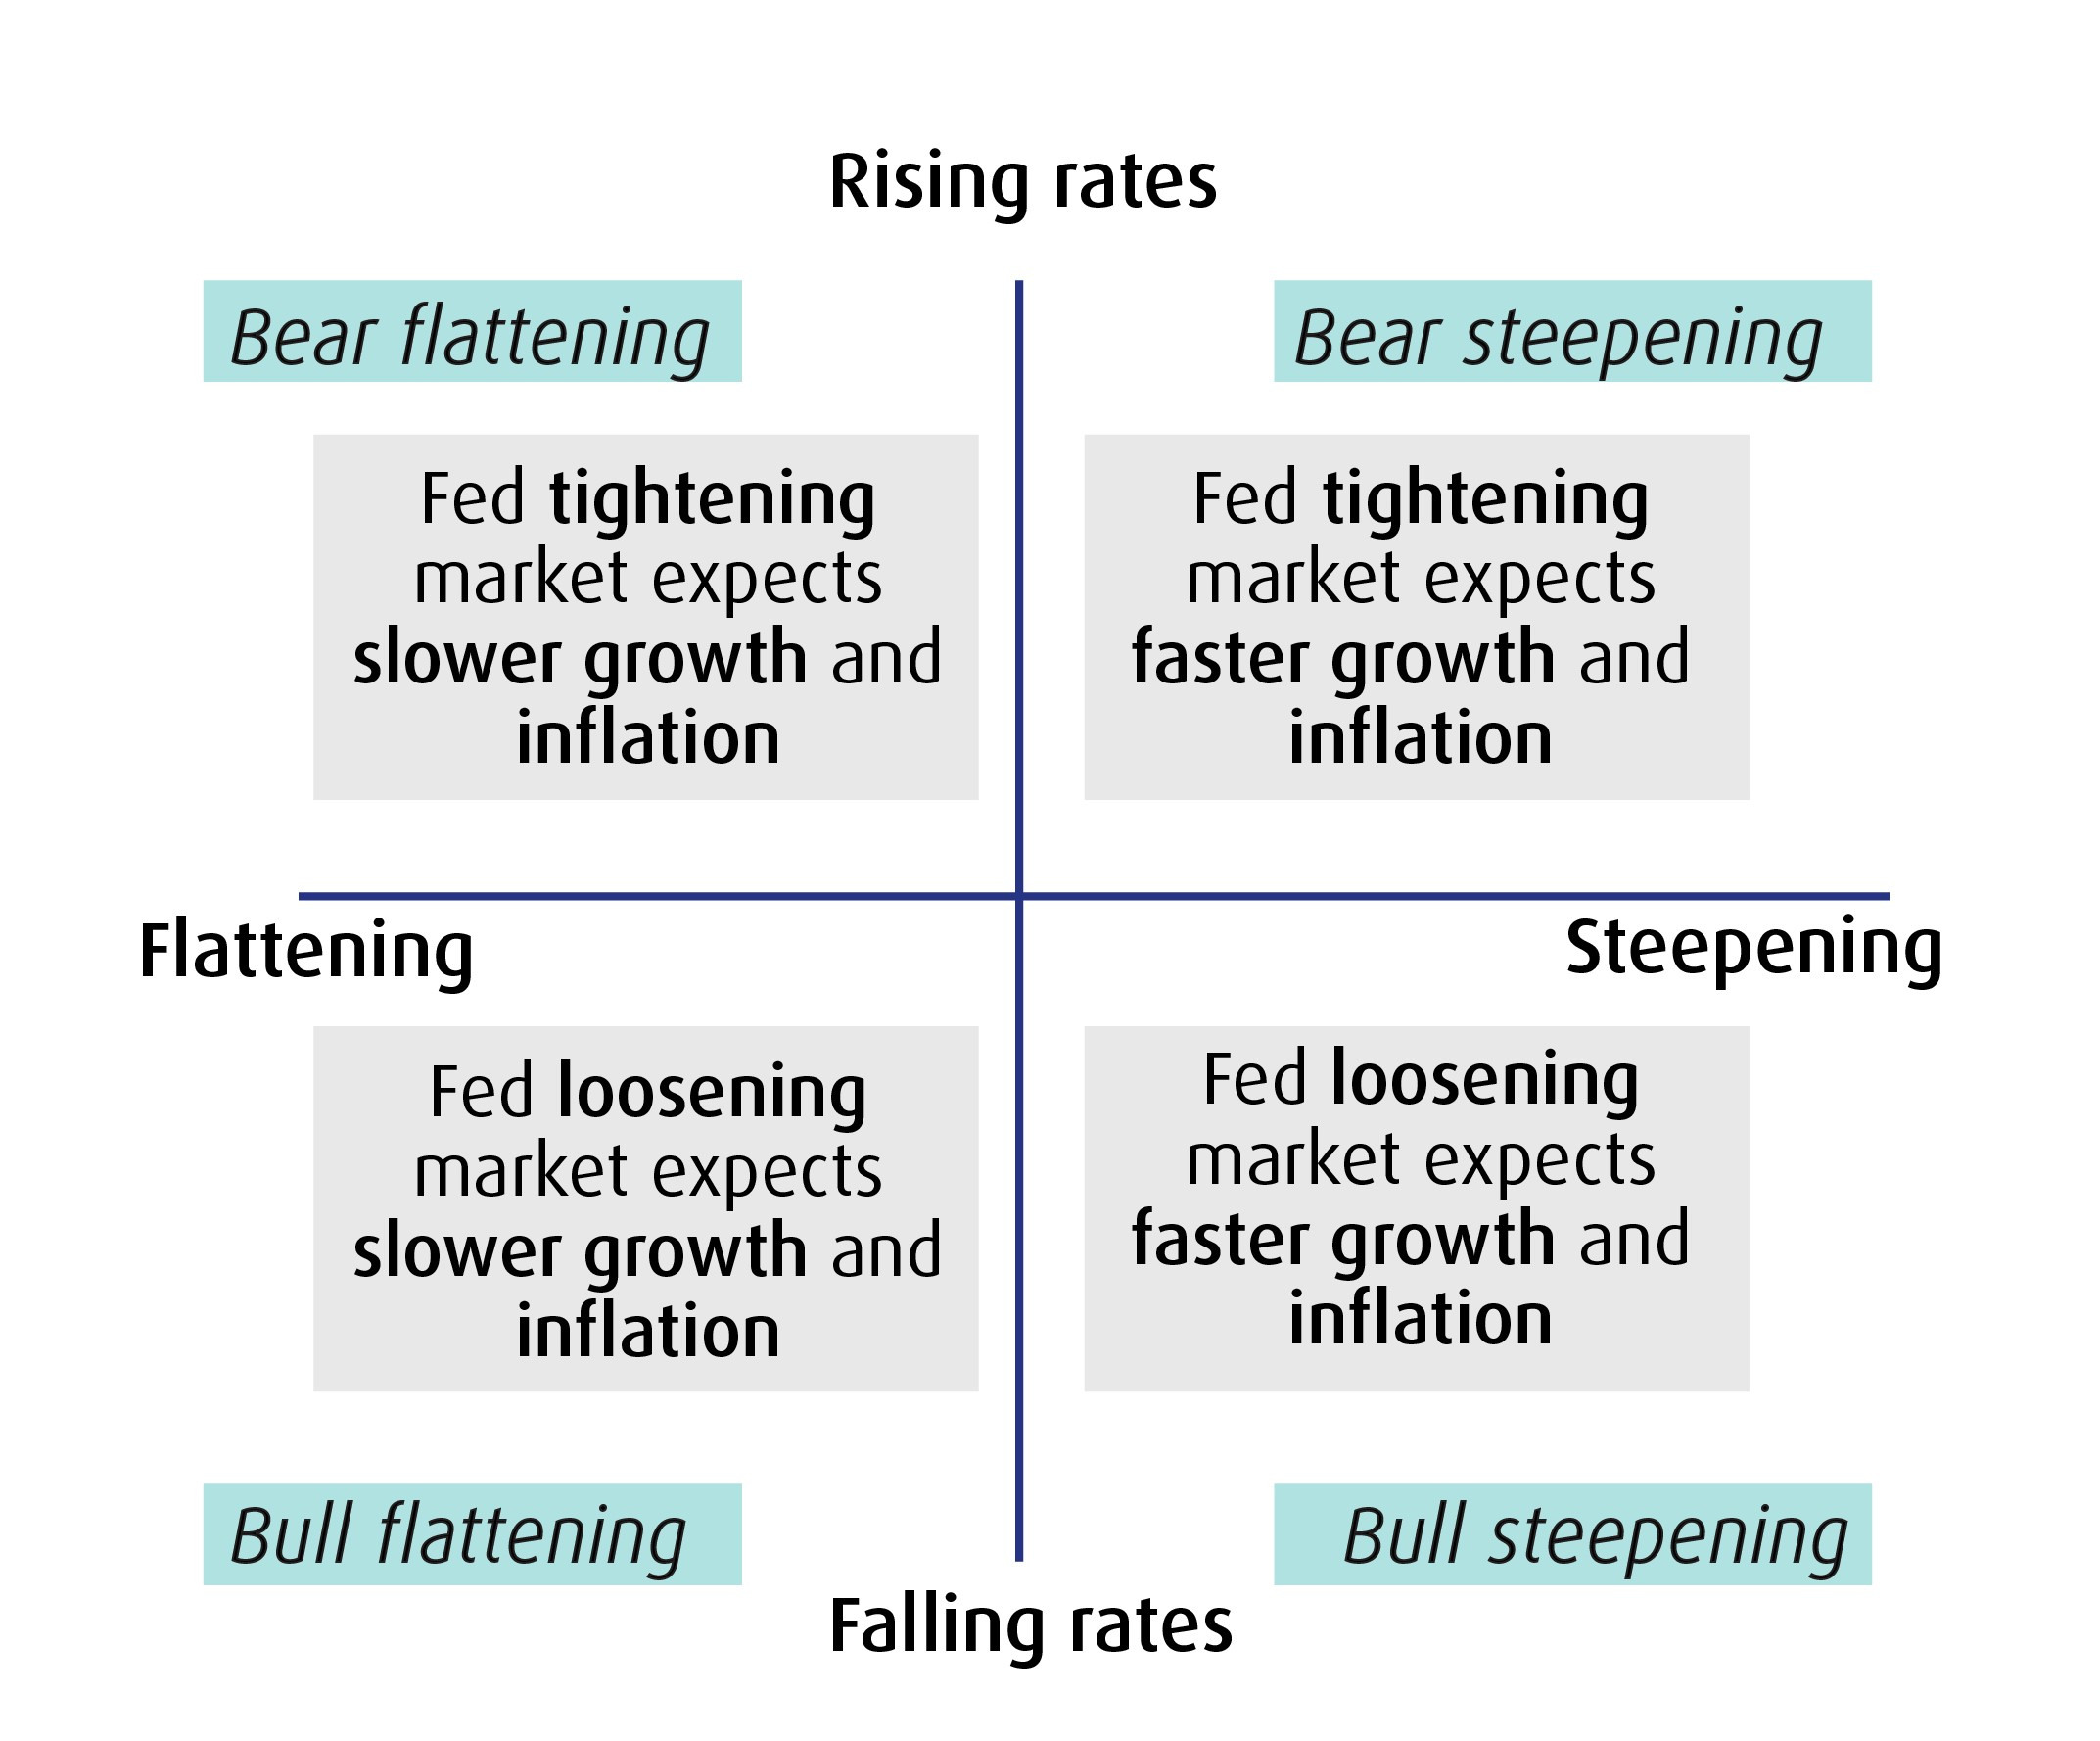
That said, not all inflationary environments are alike. The chart below shows four possible yield curve scenarios, as well as their respective impacts on the economy and market expectations. The two Falling Rate examples are not relevant for this article considering where central banks are currently with respect to the interest rate cycle. Our focus is on Rising Rates, because when interest rates go up, as they have been since the Bank of Canada and U.S. Federal Reserve took action in March, we typically see one of two scenarios: stagflation (“bear flattening”) or heating up (“bear steepening”).

Source: MSCI Factors in Focus: Are your equity styles ahead of the curve? (Data June 1994 – December 2021).
1. Stagflation
Otherwise known as “bear flattening,” this scenario occurs when an inflationary environment is paired with low growth expectations—stag- for stagnating growth and -flation for inflation. As central banks tighten credit conditions, we tend to see short-term interest rates rise faster than long-term rates. The yield curve flattens, or even inverts, as investors grow increasingly pessimistic about the economy’s near-term prospects, leading the market to rotate towards defensive sectors — such as healthcare, consumer staples and utilities — which are well represented in a Low Volatility ETF.
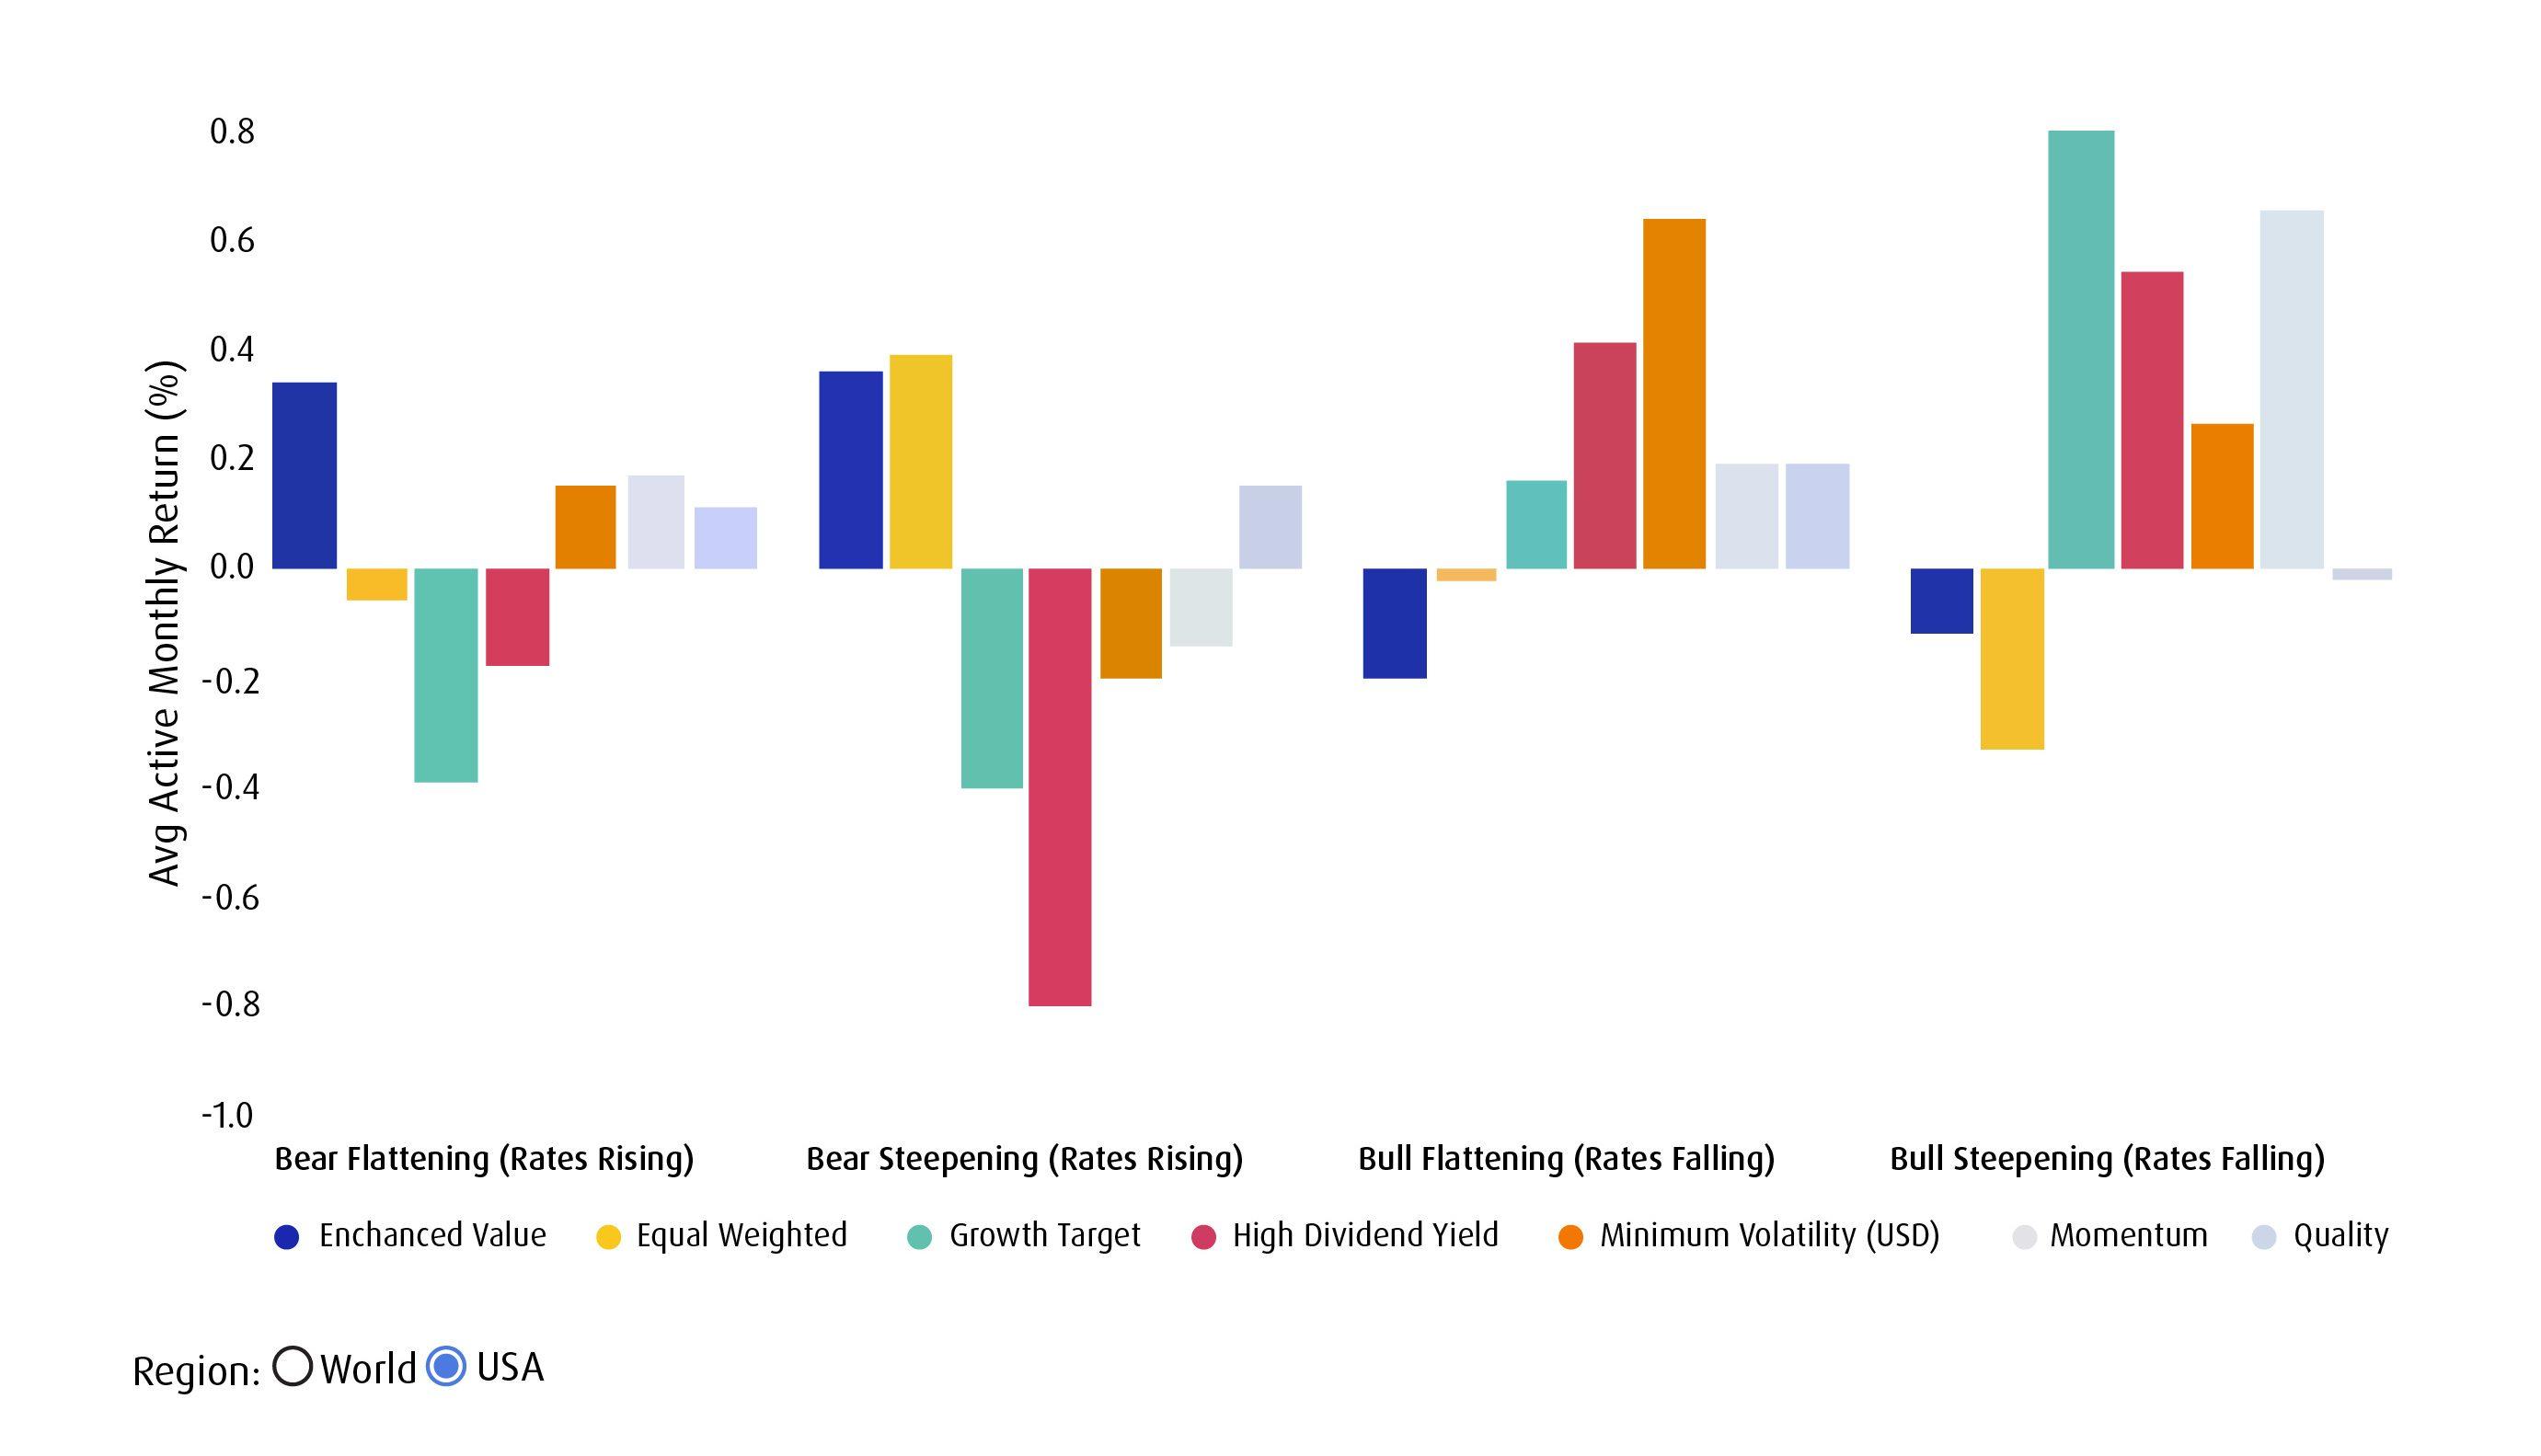
Low volatility strategies have historically outperformed during stagflation because investors become less willing to pay for risk assets and higher valuations.2 Capital that was previously earmarked for Growth equities are moved to safer ground as fundamentals come to the fore, capital preservation becomes important, and companies that have a solid, lowly correlated earnings base tend to do well.
The energy sector usually outperforms in this environment. It should be noted that BMO Low Volatility ETFs do not carry heavy weights in energy due to their high-beta characteristics, and we screen for the opposite in our security selection process. However, if energy exposure is desired, a sector ETF or some individual names can be bolted on separately. In this case, the Low Volatility ETF would serve as the core equity holding in the portfolio, with the energy ETF or specific companies acting as satellite exposures. At an MER of 33 basis points, the cost-efficiency of the low volatility ETF provides investment counsellors and family offices an easy method of tailoring their portfolios with a risk-off trade.
MSCI World and USA Factor Index performance

Period from June 1994 to December 2021 for all indexes, except the MSCI World and MSCI USA Enhanced Value indexes, which s tart in November 1997; the MSCI World Growth Target Index,which starts in June 1995; the MSCI USA Growth Target Index, which starts in December 1998; and the MSCI World and USA Quality Indexes, which start in May 1999. Interest-rate regime is defined by the month-on-month change in the 10-year constant-maturity U.S. Treasury. Yield-curve regime is defined by tile month-on-month change· in the difference between the 10-year and 2-year constant-maturity US. Treasury.
Source: FRED, Federal Reserve Bank of St. Louis.
2. Heating up
As opposed to the above scenario, inflation can also exist in an economy that’s continuing to grow rapidly. In such cases, we typically observe the 10-year Treasury yields increasing faster than short-term rates, whether that’s for the 1 or 2-year Treasury notes. The most notable characteristic of this situation is that growth and inflation are happening concurrently. This should theoretically give the central bank cover to raise rates without having a cooling effect on economic activity, although in practice investors can have negative reactions to rate hikes, such as with the 2013 “taper tantrum.”
Value performs well in this “bear steepening” scenario, as do Equal Weight and Quality. It is interesting to note that the Quality and Momentum factors generally outperform in both inflationary environments and, of the two factors, Quality has lower risk. The BMO Value ETFs use the MSCI Enhanced Value Indexes, which filters the investable universe for low Price to Book, low forward Price to Earnings ratios, and low Enterprise Value to Operating Cash Flows. On the sector side, many of our ETFs use Equal Weighting to take an even-handed exposure. Meanwhile, the BMO Quality ETFs use the MSCI High Quality Indexes for portfolio construction, screening for strong fundamentals defined by Return-on-Equity, Stable Earnings Growth and low Debt-to-Equity. If you are unsure about the inherent risk level of your factor tilts, the chart below is a good illustration of how factors tend to rank in terms of risk over the long term.

Differentiate by geography – easily
Another consideration is the disparity in macroeconomic conditions from one area of the world to another. For example, the ongoing Russia-Ukraine conflict is undoubtedly a risk factor for global commodity markets, but the impact is disproportionately felt in Europe, where countries like Germany are heavily dependent on Russia’s oil and natural gas exports.
If a portfolio manager felt Europe were on track for stagflation, but they still wanted the region in their mandate, they could opt for the BMO Low Volatility International Equity ETF (Ticker: ZLI), which has significant exposure to the European market. Alternatively, they could go with the high-quality exposure BMO MSCI Europe High Quality Hedged to CAD Index ETF (Ticker: ZEQ)—both ETFs have helped reduce the impact of the current crisis on returns. By contrast, the PM may feel Canada is headed for a steeper yield curve in the medium term relative to Europe, and would therefore choose to access their domestic equity exposure through BMO MSCI Canada Value Index ETF (Ticker: ZVC).
Bottom line: beyond the cost-efficiency and ease of use of ETFs, they can also be invaluable for portfolio managers looking to mitigate the impact of inflation on portfolios.
BMO has been the the largest provider of factor ETFs to the Canadian marketplace,3 and we are eager to support you and your clients’ portfolios with our expertise and insights.
To learn more about factor-based investing, or receive other trading insights, reach out to your BMO ETF Specialist at their email address or through 1−877−741−7263.
| VIRTUAL EVENT: Wednesday, April 27│ 11am-12pm ET
How Factor ETFs Perform in Shifting Markets & Inflationary Times Factor investing combines the transparency of an index along with a concentrated, high conviction portfolio, which offers Active Share and Alpha opportunities inherent with an active management style. In this webinar, we will outline how Factor ETFs perform in evolving markets while highlighting the investment characteristics that have demonstrated superior performance under inflationary conditions, like those we’re currently experiencing. Topics will include:
Our moderator Erika Toth will interview Alex Perel, Scotia Capital Markets. |
3 Canadian ETF Association (CETFA) Monthly Report, factor ETF assets under management as of December 31, 2021.
Disclosures:
Any statement that necessarily depends on future events may be a forward-looking statement. Forward-looking statements are not guarantees of performance. They involve risks, uncertainties and assumptions. Although such statements are based on assumptions that are believed to be reasonable, there can be no assurance that actual results will not differ materially from expectations. Investors are cautioned not to rely unduly on any forward-looking statements. In connection with any forward-looking statements, investors should carefully consider the areas of risk described in the most recent simplified prospectus.
The viewpoints expressed by the authors represents their assessment of the markets at the time of publication. Those views are subject to change without notice at any time without any kind of notice. The information provided herein does not constitute a solicitation of an offer to buy, or an offer to sell securities nor should the information be relied upon as investment advice. Past performance is no guarantee of future results. The statistics in this update are based on information believed to be reliable but not guaranteed.
This article is for information purposes. The information contained herein is not, and should not be construed as, investment, tax or legal advice to any party. Investments should be evaluated relative to the individual’s investment objectives and professional advice should be obtained with respect to any circumstance.
The BMO ETFs or securities referred to herein are not sponsored, endorsed or promoted by MSCI Inc. (“MSCI”), and MSCI bears no liability with respect to any such BMO ETFs or securities or any index on which such BMO ETFs or securities are based. The prospectus of the BMO ETFs contains a more detailed description of the limited relationship MSCI has with BMO Asset Management Inc. and any related BMO ETFs.
Commissions, management fees and expenses all may be associated with investments in exchange traded funds. Please read the ETF Facts or prospectus before investing. The indicated rates of return are the historical annual compounded total returns including changes in unit value and reinvestment of all dividends or distributions and do not take into account sales, redemption, distribution or optional charges or income taxes payable by any unitholder that would have reduced returns. Exchange traded funds are not guaranteed, their values change frequently and past performance may not be repeated.
For a summary of the risks of an investment in the BMO ETFs, please see the specific risks set out in the prospectus. BMO ETFs trade like stocks, fluctuate in market value and may trade at a discount to their net asset value, which may increase the risk of loss. Distributions are not guaranteed and are subject to change and/or elimination.
BMO ETFs are managed by BMO Asset Management Inc., which is an investment fund manager and a portfolio manager, and a separate legal entity from Bank of Montreal.
BMO Global Asset Management comprises BMO Asset Management Inc. and BMO Investments Inc.
®/™Registered trade-marks/trade-mark of Bank of Montreal, used under licence.