How the Quality Factor Has Outperformed in 3 Charts
Dec. 10, 2024One of the most intuitive smart beta factors is quality investing. Quality-based investing is built to identify market leading companies with sustainable competitive advantages. As market participation has broadened among equities, much attention has been paid to how best to allocate into vehicles poised to benefit. Equal-weight strategies are one method; however, research shows that a high-quality focus has also earned a premium while reducing risk over longer periods of time relative to the broader market.1
As shown below, BMO ETFs’ factor-screening indexes have benefitted by using a fundamentally weighted methodology with a 5% single-name cap. The weight of each name in the index is determined by market capitalization adjusted for a proprietary ‘Quality’ score based on a publicly available methodology (more on this further below).
Featured ETFs
- BMO MSCI USA High Quality Index ETF (Ticker: ZUQ)
- BMO MSCI USA High Quality Index ETF Hedged Units (Ticker: ZUQ.F)
- BMO MSCI USA High Quality Index ETF US Dollar Units (Ticker: ZUQ.U)
- BMO MSCI All Country World High Quality Index ETF (Ticker: ZGQ)
- BMO MSCI Europe High Quality Hedged to CAD Index ETF (Ticker: ZEQ)
- BMO MSCI EAFE High Quality Index ETF (Ticker: ZIQ)
Part of the value is in the meaningful difference from traditional market capitalization indices where Quality provides effective exposure throughout the entire market cycle. Furthermore, higher quality screening avoids inexpensive stocks masquerading as bargains.
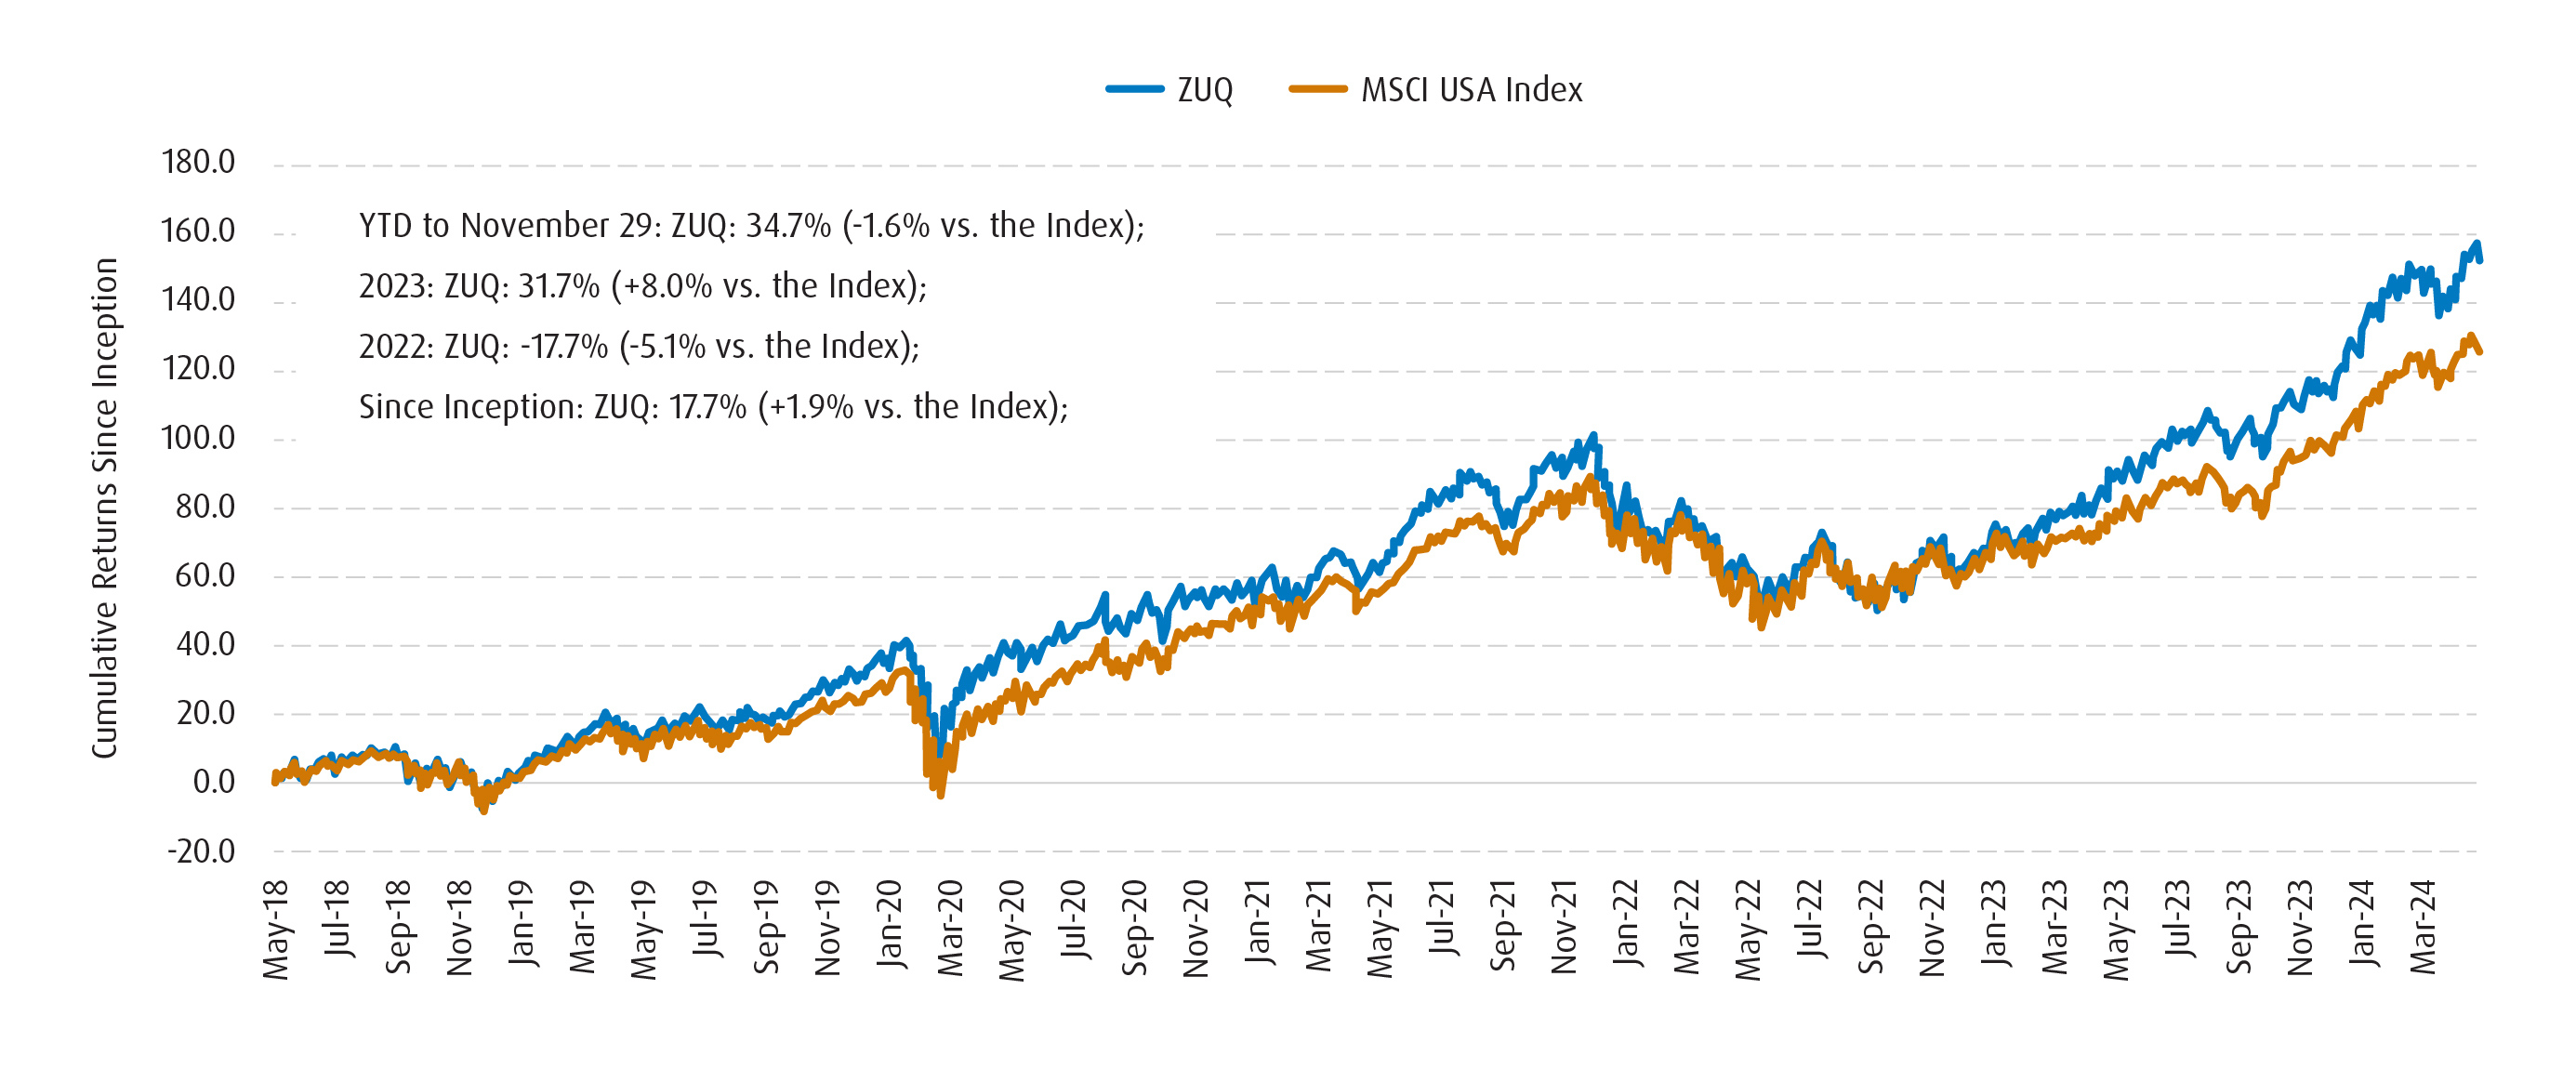
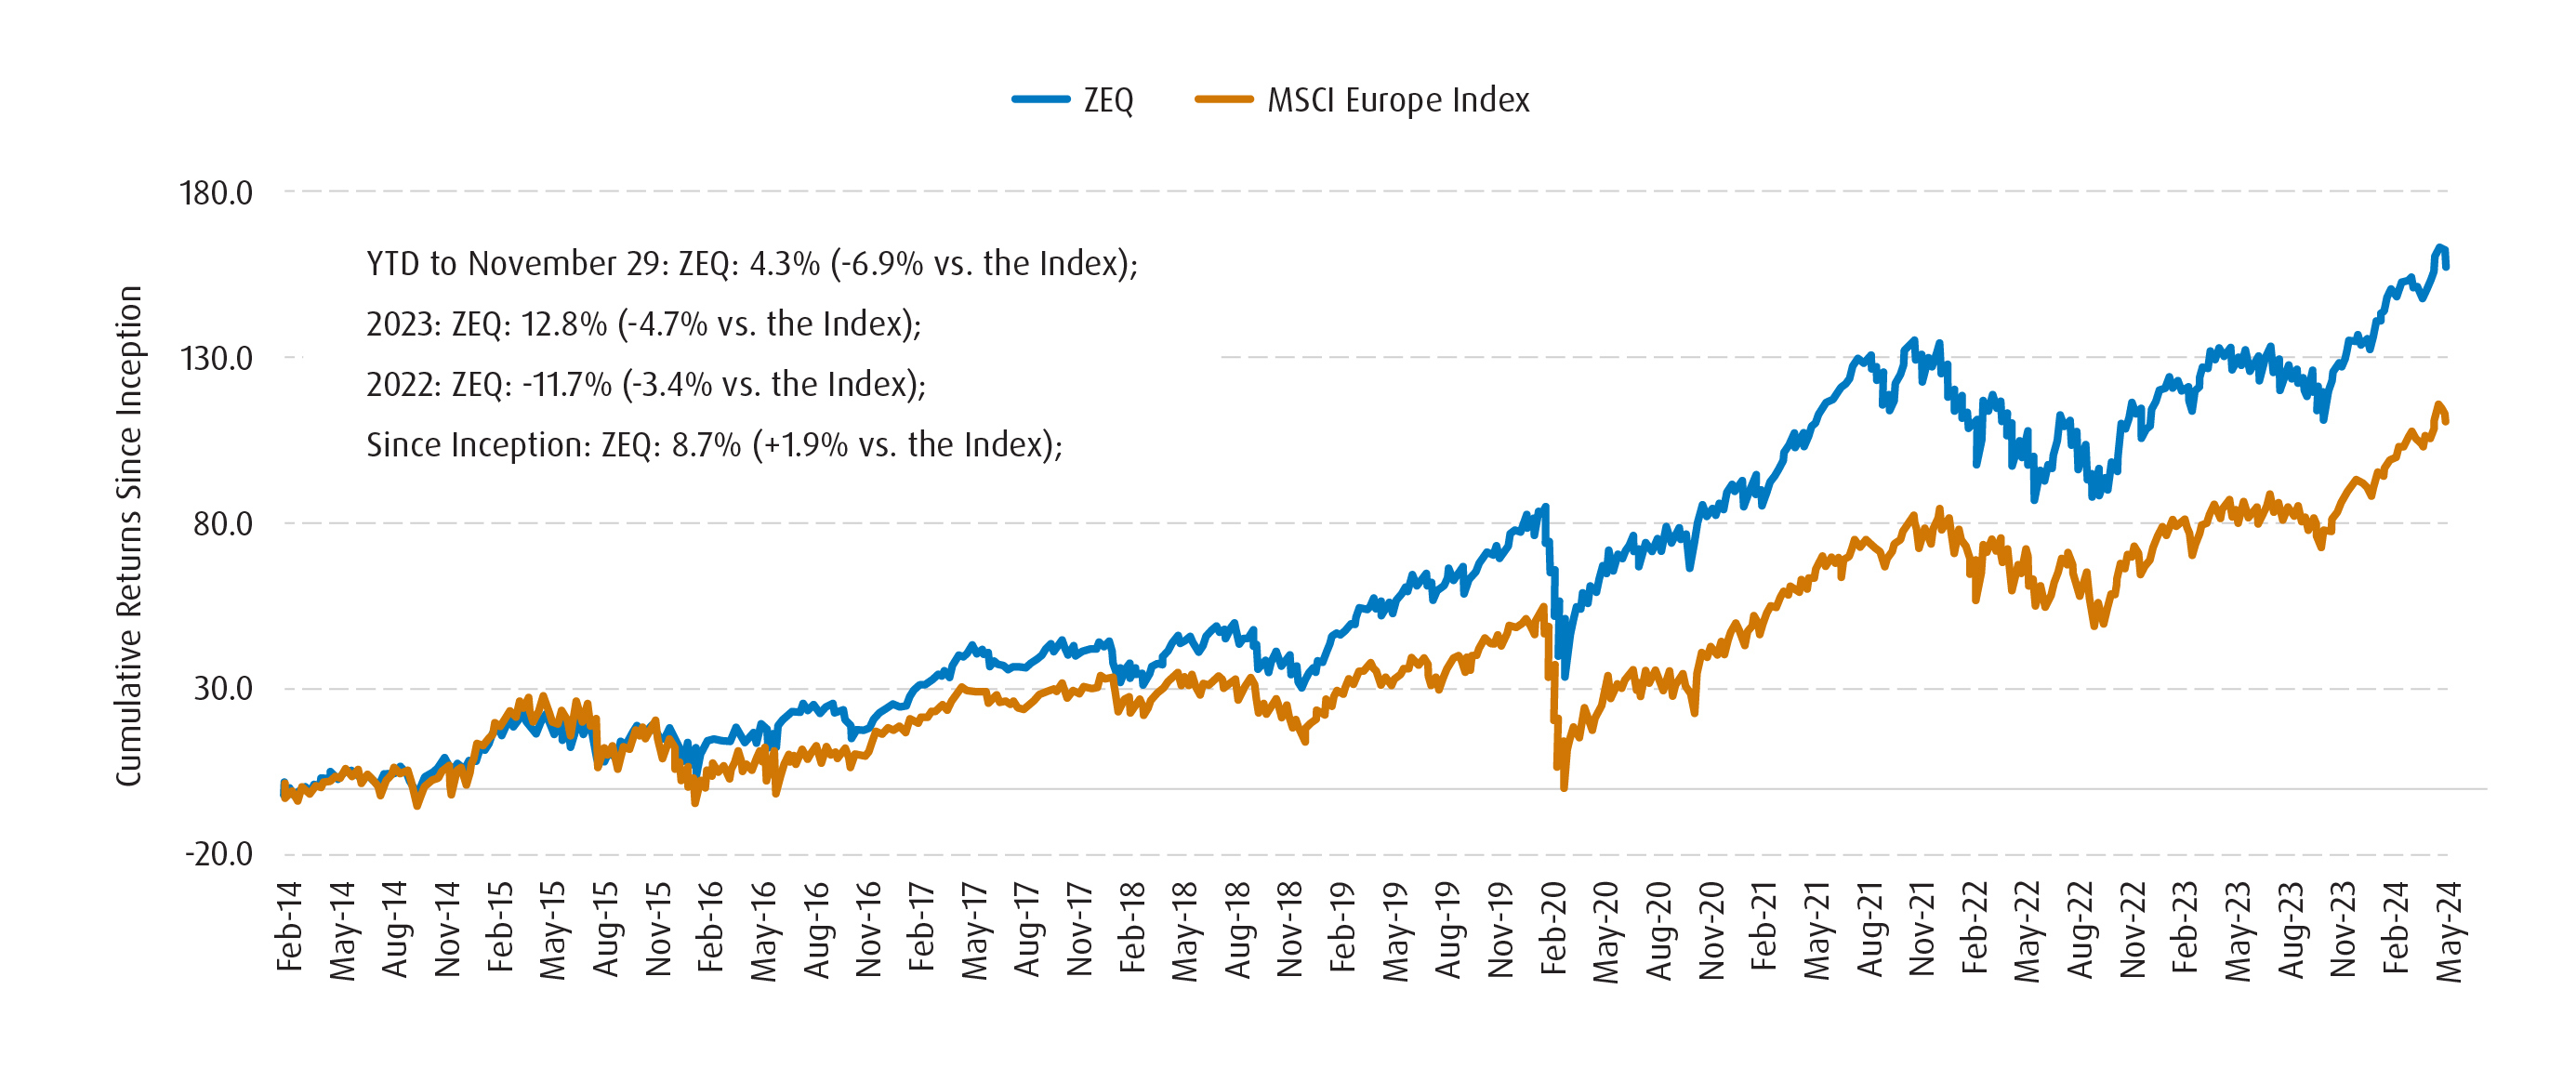
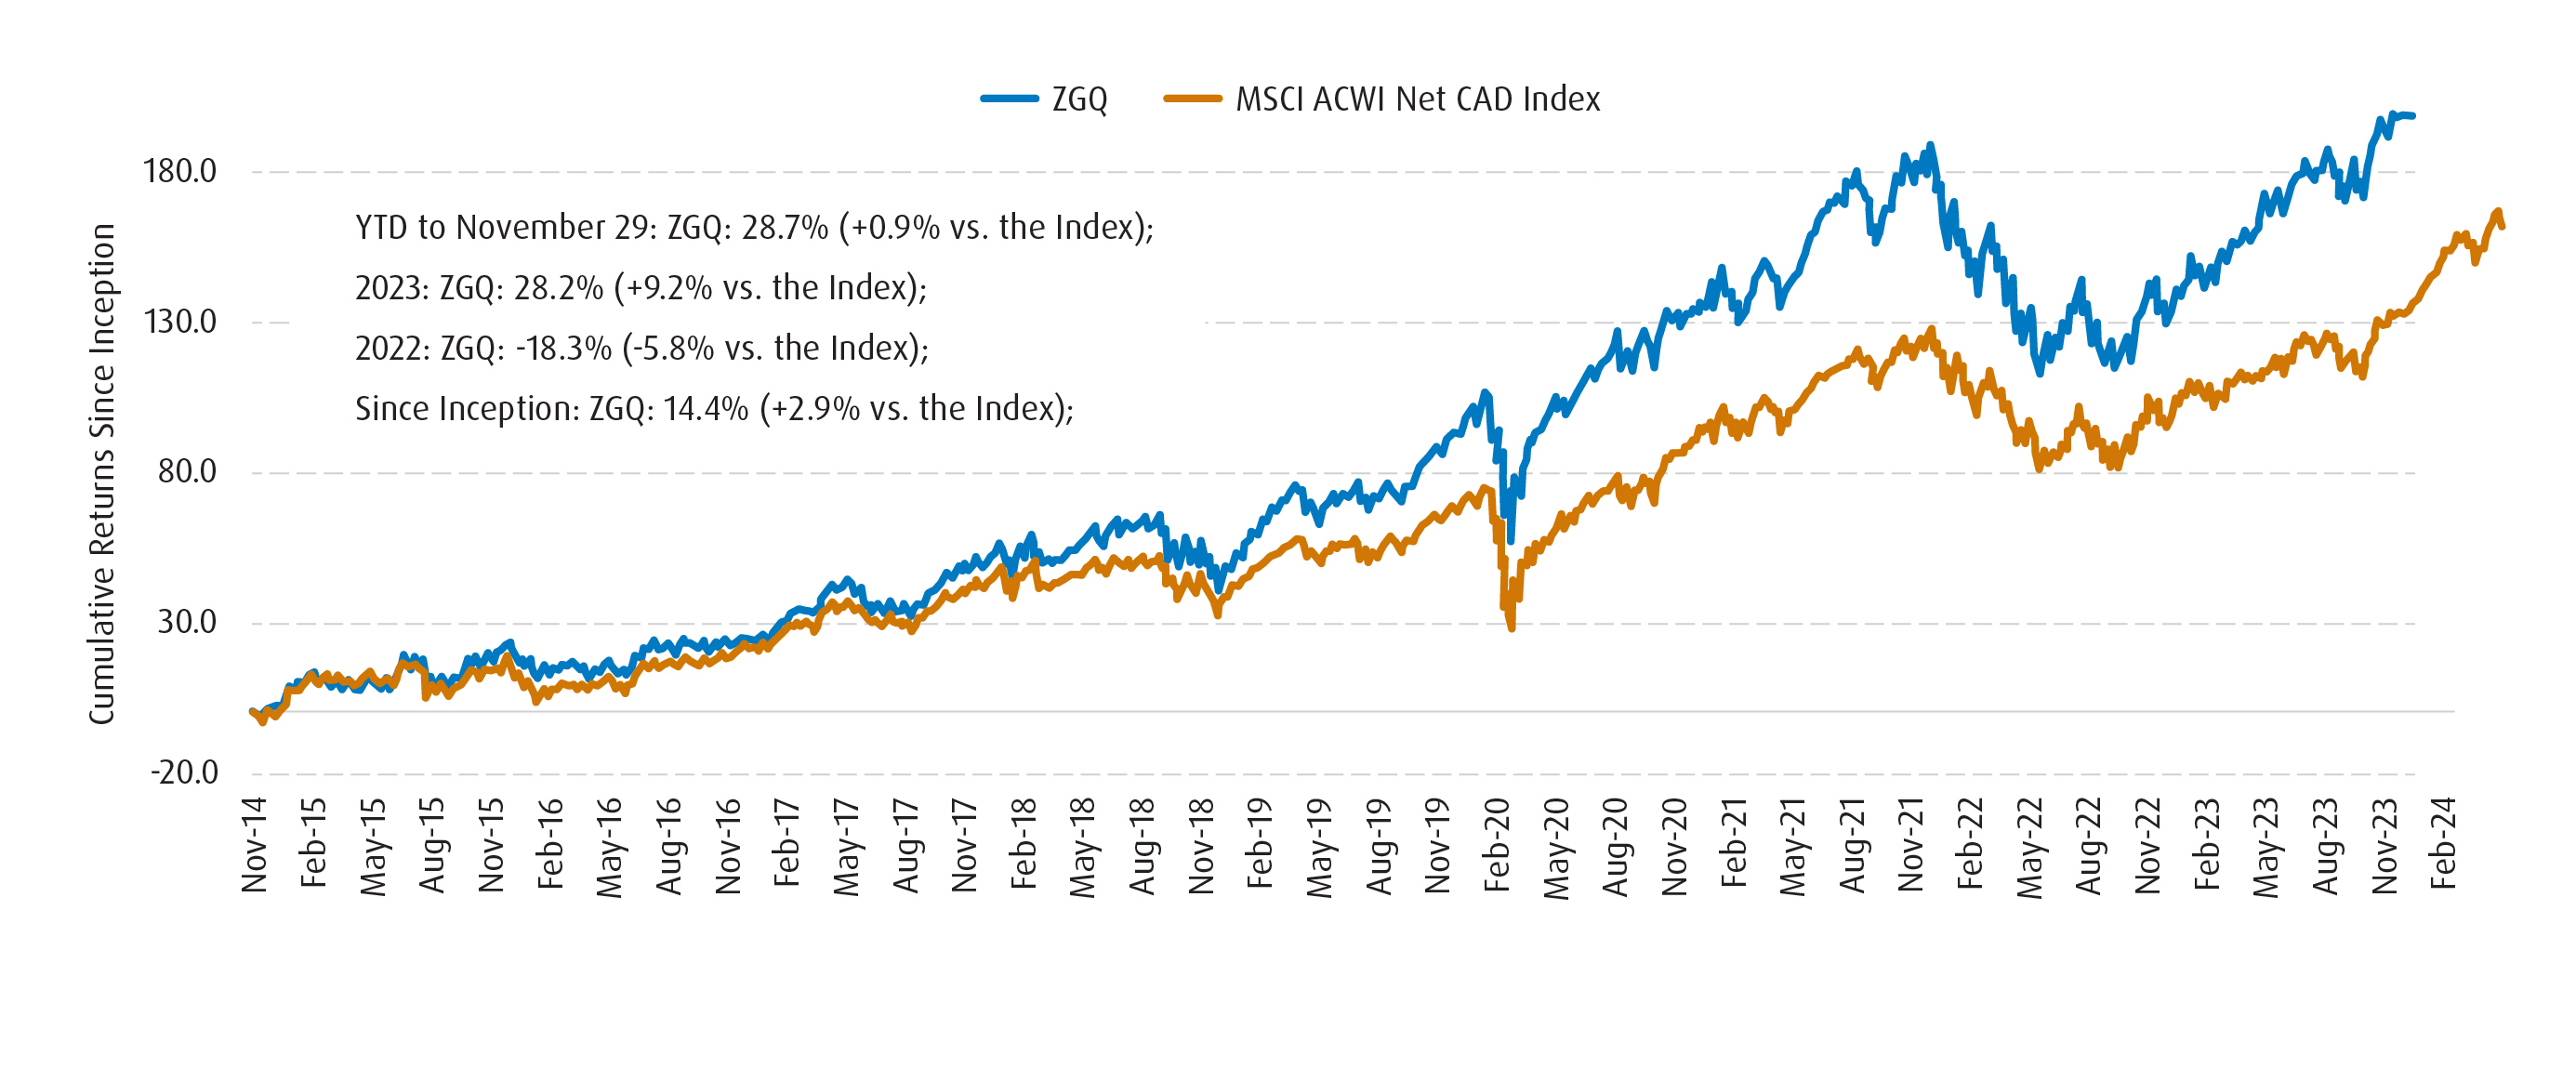
Underscoring the factor’s track record is the comparison of the MSCI Quality Indexes to their corollary U.S., European and global market-cap indexes. In all three regions, high-quality equities have consistently overperformed, as shown in the charts below:
BMO MSCI USA High Quality Index ETF (ZUQ) vs. MSCI USA Index

BMO MSCI Europe High Quality Hedged to CAD Index ETF (ZEQ) vs. MSCI Europe Index

BMO MSCI All Country World High Quality Index ETF (ZGQ) vs. MSCI ACWI Index

Methodology
BMO Quality ETFs track the performance of MSCI quality indices which are a subset of the broad market parent indices. Security selection relies on the determination of the three Quality variables. Weighting is based on a combination of the security’s Quality scores and market capitalization. Quality indices are rebalanced semi-annually.

BMO ETFs’ Full Suite of Quality ETFs
BMO MSCI USA High Quality Index |
BMO MSCI All Country World High Quality Index ETF |
BMO MSCI Europe High Quality Hedged to CAD Index |
NEW!! BMO MSCI EAFE High Quality Index ETF |
Distribution Frequency: |
Distribution Frequency: |
Distribution Frequency: |
Distribution Frequency: |
Management Fee: |
Management Fee: |
Management Fee: |
Management Fee: |
Risk Rating: 6 |
Risk Rating: 6 |
Risk Rating: 6 |
Risk Rating: 6 |
For more detailed methodology information regarding the Quality variables, security composition scoring, security selection, weighting and index maintenance, visit the MSCI indices website:
1MSCI Research Report “Quality Time,” June 2023.
2Return (Risk-Adjusted): A measure of investment performance taking into consideration how much risk/volatility was assumed to generate it. Consider two investments, both of which return 10% over a given time period. The investment with the greater risk-adjusted return would be the one that experienced less price fluctuation. Two of the most commonly used measures of risk adjusted returns are Sharpe and Sortino ratios.
Performance Data (%)
Fund |
Year-to-Date |
1-Month |
3-Month |
6-Month |
1-Year |
3-Year |
5-Year |
10-Year |
Since Inception |
34.73 |
4.98 |
7.51 |
14.83 |
37.87 |
14.83 |
17.64 |
17.00 |
17.21 |
|
26.40 |
4.35 |
3.22 |
11.14 |
32.22 |
10.19 |
- |
- |
15.49 |
|
27.50 |
4.40 |
3.48 |
11.78 |
33.62 |
11.37 |
- |
- |
16.62 |
|
28.68 |
3.10 |
4.21 |
9.89 |
31.74 |
11.59 |
15.39 |
14.46 |
14.69 |
|
4.26 |
-0.62 |
-7.16 |
-5.54 |
8.25 |
3.42 |
7.39 |
8.55 |
9.05 |
|
Returns are not available as there is less than one year’s performance data. |
|||||||||
As of November 30, 2024. Inception date for ZUQ and ZGQ was November 5, 2014.
Inception date for ZUQ.F and ZUQ.U was July 17, 2020.
Disclaimers:
For Advisor Use Only
The communication is for information purposes. The information contained herein is not, and should not be construed as, investment, tax or legal advice to any party. Particular investments and/or trading strategies should be evaluated relative to the individual’s investment objectives and professional advice should be obtained with respect to any circumstance.
Any statement that necessarily depends on future events may be a forward-looking statement. Forward-looking statements are not guarantees of performance. They involve risks, uncertainties and assumptions. Although such statements are based on assumptions that are believed to be reasonable, there can be no assurance that actual results will not differ materially from expectations. Investors are cautioned not to rely unduly on any forward-looking statements. In connection with any forward-looking statements, investors should carefully consider the areas of risk described in the most recent simplified prospectus.
Third Party Links and Content
This article may contain links to other sites that BMO Global Asset Management does not own or operate. Also, links to sites that BMO Global Asset Management owns or operates may be featured on third party websites on which we advertise, or in instances that we have not endorsed. Links to other websites or references to products, services or publications other than those of BMO Global Asset Management on this [article, presentation, communication, material - revise as appropriate] do not imply the endorsement or approval of such websites, products, services or publication by BMO global Asset Management. We do not manage, and we are not responsible for, the digital marketing and cookie practices of third parties. The linked websites have separate and independent privacy statements, notices and terms of use, which we recommend you read carefully.
Any content from or links to a third-party website are not reviewed or endorsed by us. You use any external websites or third-party content at your own risk. Accordingly, we disclaim any responsibility for them.
Distribution yields are calculated by using the most recent regular distribution, or expected distribution, (which may be based on income, dividends, return of capital, and option premiums, as applicable) and excluding additional year end distributions, and special reinvested distributions annualized for frequency, divided by current net asset value (NAV). The yield calculation does not include reinvested distributions.
Distributions are not guaranteed, may fluctuate and are subject to change and/or elimination. Distribution rates may change without notice (up or down) depending on market conditions and NAV fluctuations.
The payment of distributions should not be confused with the BMO ETF’s performance, rate of return or yield. If distributions paid by a BMO ETF are greater than the performance of the investment fund, your original investment will shrink. Distributions paid as a result of capital gains realized by a BMO ETF, and income and dividends earned by a BMO ETF, are taxable in your hands in the year they are paid.
Your adjusted cost base will be reduced by the amount of any returns of capital. If your adjusted cost base goes below zero, you will have to pay capital gains tax on the amount below zero.
Cash distributions, if any, on units of a BMO ETF (other than accumulating units or units subject to a distribution reinvestment plan) are expected to be paid primarily out of dividends or distributions, and other income or gains, received by the BMO ETF less the expenses of the BMO ETF, but may also consist of non-taxable amounts including returns of capital, which may be paid in the manager’s sole discretion. To the extent that the expenses of a BMO ETF exceed the income generated by such BMO ETF in any given month, quarter, or year, as the case may be, it is not expected that a monthly, quarterly, or annual distribution will be paid. Distributions, if any, in respect of the accumulating units of BMO Short Corporate Bond Index ETF, BMO Short Federal Bond Index ETF, BMO Short Provincial Bond Index ETF, BMO Ultra Short-Term Bond ETF and BMO Ultra Short-Term US Bond ETF will be automatically reinvested in additional accumulating units of the applicable BMO ETF. Following each distribution, the number of accumulating units of the applicable BMO ETF will be immediately consolidated so that the number of outstanding accumulating units of the applicable BMO ETF will be the same as the number of outstanding accumulating units before the distribution. Non-resident unitholders may have the number of securities reduced due to withholding tax. Certain BMO ETFs have adopted a distribution reinvestment plan, which provides that a unitholder may elect to automatically reinvest all cash distributions paid on units held by that unitholder in additional units of the applicable BMO ETF in accordance with the terms of the distribution reinvestment plan. For further information, see the distribution policy in the BMO ETFs’ prospectus.
Past Performance is not indicative of future results.
BMO Global Asset Management is a brand name that comprises BMO Asset Management Inc. and BMO Investments Inc. No portion of this communication may be reproduced or distributed to clients.
All investments involve risk. The value of an ETF can go down as well as up and you could lose money. The risk of an ETF is rated based on the volatility of the ETF’s returns using the standardized risk classification methodology mandated by the Canadian Securities Administrators. Historical volatility doesn’t tell you how volatile an ETF will be in the future. An ETF with a risk rating of “low” can still lose money. For more information about the risk rating and specific risks that can affect an ETF’s returns, see the BMO ETFs’ prospectus.
This article is for information purposes only. The information contained herein is not, and should not be construed as investment, tax or legal advice to any party. Particular investments and/or trading strategies should be evaluated relative to the individual’s investment objectives and professional advice should be obtained with respect to any circumstance.
BMO Global Asset Management is a brand name under which BMO Asset Management Inc. and BMO Investments Inc. operate.
The ETF referred to herein is not sponsored, endorsed, or promoted by MSCI or Bloomberg and they each bear no liability with respect to any such ETF or any index on which such ETF is based. The ETF’s prospectus contains a more detailed description of the limited relationship MSCI or Bloomberg have with the Manager and any related ETF.
Commissions, management fees and expenses all may be associated with investments in exchange traded funds. Please read the ETF Facts or prospectus of the BMO ETFs before investing. The indicated rates of return are the historical annual compounded total returns including changes in unit value and reinvestment of all dividends or distributions and do not take into account sales, redemption, distribution or optional charges or income taxes payable by any unitholder that would have reduced returns. Exchange traded funds are not guaranteed, their values change frequently and past performance may not be repeated.
For a summary of the risks of an investment in the BMO ETFs, please see the specific risks set out in the BMO ETF’s prospectus. BMO ETFs trade like stocks, fluctuate in market value and may trade at a discount to their net asset value, which may increase the risk of loss. Distributions are not guaranteed and are subject to change and/or elimination.
BMO ETFs are managed by BMO Asset Management Inc., which is an investment fund manager and a portfolio manager, and a separate legal entity from Bank of Montreal.
BMO Global Asset Management is a brand name under which BMO Asset Management Inc. and BMO Investments Inc. operate.
“BMO (M-bar roundel symbol)” is a registered trademark of Bank of Montreal, used under licence.