How to Play the Broadening of the U.S. Market: Rotate to Mid and Small Caps
Jul. 30, 2024
U.S equities delivered strong performance in the first half of 2024 with the mega-cap “Magnificent 7” stocks leading the way. The S&P 500 is currently up about 19% year-to-date, and the Mag 7 now account for about 30% of the index.1 This concentration risk presents investors with a unique opportunity to diversify into stocks with smaller market capitalizations. Small cap equities have been trading at a discount relative to their larger-cap counterparts, and as the market’s rally broadens and interest rates appear poised to fall, small- and medium-cap stocks are expected to play catch up.
ETFs in Focus
- BMO S&P US Mid Cap Index ETF (Ticker: ZMID | Hedged Units - ZMID.F | USD Units - ZMID.U)
-
BMO S&P US Small Cap Index ETF (Ticker: ZSML | Hedged Units - ZSML.F | USD Units - ZSML.U)
Benefits
- Exposure to diversified U.S. medium- and small-cap equities
- Designed for investors looking for growth solutions
- Falling U.S. interest rates amid steady economic conditions may provide tailwind
According to JP Morgan, the forward price-to-earnings ratio on small cap U.S. equities has fallen to lows last seen in early 2000s (see chart below). The current forward P/E ratio provides a potentially attractive entry point ahead of another possible rally.
On a relative valuation basis, P/E ratios across the S&P Mid Cap 400 and S&P Small Cap 600 indexes are 15.24 and 14.45, respectively — well below the ratio for the benchmark S&P 500, which sits currently at 21.2
Forward P/E Ratio: Small Cap Stock Relative to Same Cohort of Large Cap Stocks

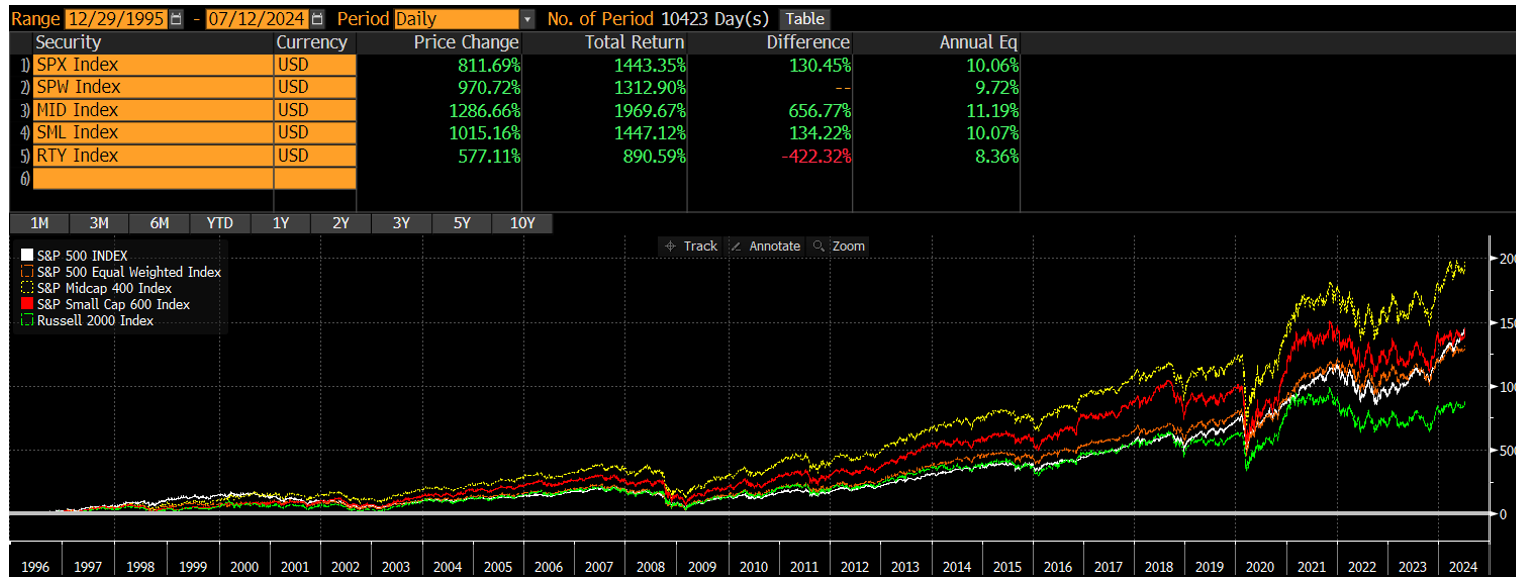
Historically, falling interest rates have provided a tailwind for equities. Current market expectations put the chances of a rate cut from the U.S. Federal Reserve in September at 93%.3 The commencement of rate cuts provides a tactical opportunity to rotate into mid- and small-cap stocks as smaller companies that have a greater reliance on debt and floating rates relative to large caps benefit from easing financial conditions. Furthering the case for the rotation, earnings growth has been spreading from large caps to medium- and smaller-size companies as the market continues to broaden out. Finally, U.S. small- and mid-caps have benefitted from the size equity premium historically, outperforming the S&P 500 in the long run (see chart below).4
Historical Outperformance of S&P Small/Mid-Cap Indexes vs. S&P 500 Index
For investors seeking to capitalize on the potential for mid and small caps to break out, here are some ways to play the broadening of the market:
BMO S&P US Mid Cap Index ETF (Ticker: ZMID)
- Diversified exposure to the top 400 US mid-sized companies screened for liquidity and quality. To put the sheer size of the S&P Midcap 400 & 600 indices into perspective, the index market capitalization sizes are larger than Canada and South Korea’s entire equity market, respectively.
Index Market Capitalization Size

A key characteristic of BMO’s mid- and small-cap ETFs is a profitability screen that is applied by the index, which filters out for low quality. Stocks are screened by the underlying index for a positive net income on a trailing 12-month and most recent quarter basis. This is an important step to help filter out certain risks associated with mid and smaller cap companies.
- Mid cap companies have successfully navigated the challenges specific to smaller public companies, such as raising capital and managing early growth, often having established infrastructure, access to financing and distribution systems making them more stable relative to small caps.
- Management Fee: 0.20%
BMO S&P US Small Cap Index ETF (Ticker: ZSML)
- Diversified exposure to the top 600 U.S. small-cap companies, with an index-level screen for liquidity and profitability. Not all small caps are created equal so investors will need to be discerning in which small caps to invest in, considering the risks of leverage and weaker earnings relative to large caps.
- The Russell 2000 is a common way for investors to get exposure to small caps, however due to unique methodology, including the profitability screen within underlying index used by ZSML, it has outperformed the Russell 2000 by 1.7% annualized since 1995.
- Gain an exposure to companies that may be on the leading edge of innovation and potential for market growth into larger mid caps, and eventually into a stock that could enter the S&P 500.
- ZMID and ZSML offer additional sector diversification exposure to further lower a portfolio’s correlation to the broader S&P 500, due to higher weights in Industrials, Financials and Real Estate.
Mid & Small Caps Sector Weighting

- Management Fee: 0.20%
Large caps have the size and scale to withstand a potential economic slowdown, which can still be possible in the medium-term. Investors should be aware smaller cap companies by contrast are more vulnerable to macro risks and a weaker consumer.
However, investors with a longer-term investment horizon, quality small- and mid-cap stocks offer not only the prospect for long-term growth, but also the potential for portfolio diversification from investing across the market-cap spectrum, particularly for investors who have already gained from mega-cap stock exposure and have a greater percentage of their equity portfolio invested in large-cap stocks. Allocating a satellite position in an overall equity portfolio to small- and mid-cap stocks, assuming an appropriate time horizon and risk tolerance, can be beneficial to long-term risk-adjusted returns.
Historical Performance
Fund |
Ticker |
1-Year |
2-Year |
3-Year |
Since Inception |
BMO S&P US Small Cap Index ETF |
ZSML |
11.89% |
12.08% |
2.61% |
7.55% |
BMO S&P US Mid Cap Index ETF |
ZMID |
16.86% |
18.66% |
7.49% |
10.10% |
Source: BMO Global Asset Management, June 30 2024. The inception date for both the BMO S&P US Small Cap Index ETF and BMO S&P US Mid Cap Index ETF was February 5, 2020.
1 BMO Global Asset Management, June 30, 2024
2 JP Morgan/S&P Dow Jones, as of June 30, 2024
3 CME FedWatch Tool, June 30, 2024.
4 Size risk premium is the additional return investors expect to earn from small-cap stocks compared to large-cap stocks. Small-cap stocks are generally riskier, and therefore investors demand a higher return to compensate for additional risk.
Advisor Use Only.
The communication is for information purposes. The information contained herein is not, and should not be construed as, investment, tax or legal advice to any party. Particular investments and/or trading strategies should be evaluated relative to the individual’s investment objectives and professional advice should be obtained with respect to any circumstance.
Any statement that necessarily depends on future events may be a forward-looking statement. Forward-looking statements are not guarantees of performance. They involve risks, uncertainties and assumptions. Although such statements are based on assumptions that are believed to be reasonable, there can be no assurance that actual results will not differ materially from expectations. Investors are cautioned not to rely unduly on any forward-looking statements. In connection with any forward-looking statements, investors should carefully consider the areas of risk described in the most recent simplified prospectus.
Commissions, management fees and expenses all may be associated with investments in exchange traded funds. Please read the ETF Facts or prospectus of the BMO ETFs before investing. The indicated rates of return are the historical annual compounded total returns including changes in unit value and reinvestment of all dividends or distributions and do not take into account sales, redemption, distribution or optional charges or income taxes payable by any unitholder that would have reduced returns. Exchange traded funds are not guaranteed, their values change frequently and past performance may not be repeated.
For a summary of the risks of an investment in the BMO ETFs, please see the specific risks set out in the BMO ETF’s prospectus. BMO ETFs trade like stocks, fluctuate in market value and may trade at a discount to their net asset value, which may increase the risk of loss. Distributions are not guaranteed and are subject to change and/or elimination.
BMO ETFs are managed by BMO Asset Management Inc., which is an investment fund manager and a portfolio manager, and a separate legal entity from Bank of Montreal.
The Index is a product of S&P Dow Jones Indices LLC or its affiliates (“SPDJI”), and has been licensed for use by the Manager. S&P®, S&P 500®, US 500, The 500, iBoxx®, iTraxx® and CDX® are trademarks of S&P Global, Inc. or its affiliates (“S&P”) and Dow Jones® is a registered trademark of Dow Jones Trademark Holdings LLC (“Dow Jones”), and these trademarks have been licensed for use by SPDJI and sublicensed for certain purposes by the Manager. The ETF is not sponsored, endorsed, sold or promoted by SPDJI, Dow Jones, S&P, their respective affiliates, and none of such parties make any representation regarding the advisability of investing in such product(s) nor do they have any liability for any errors, omissions, or interruptions of the Index.
BMO Global Asset Management is a brand name under which BMO Asset Management Inc. and BMO Investments Inc. operate.
“BMO (M-bar roundel symbol)” is a registered trademark of Bank of Montreal, used under licence.