The ‘Broadening Out’ Theme Is in Motion


- Heading into this year, a sizeable contingent of investors anticipated a broadening out of momentum away from the ‘Magnificent 7’ stocks (Alphabet, Amazon, Apple, Meta Platforms, Microsoft, NVIDIA, and Tesla). From a sectoral perspective, that meant rotating away from Communications, Technology and Discretionary, and into sectors that offered potential value.
- To an extent, we’ve seen this theme play out so far this year — with Tech and Discretionary underperforming relative to other sectors (Chart 1). Indeed, among the sectors that have surprised so far this year are Healthcare (+5.85% year-to-date) and Materials (+5.92%). If you recall, those two sectors underwhelmed in 2024.
- The Communications sector is still pulling in strong returns, and the earnings outlook there continues to look constructive (Chart 2). With favourable seasonal tailwinds over the coming months (Chart 3), we’d suspect momentum to continue there in the near term.
- However, we do see headwinds looming for the communications sector later in the year. That is because we’re a bit concerned with how long this expansion phase of the U.S. economy has been. Indeed, using the Organisation for Economic Co-operation and Development’s (OECD) suite of leading indicators,1 we can see that this expansion has lasted 22 months — which is not far from the average of the past five expansions (Chart 4).
- Once the transition from expansion to slowdown is confirmed, historical analysis tells us that momentum in the communications sector should ebb. That has largely been the case during prior slowdowns.
- For now, outside of communications, our preference is to remain invested in the Healthcare and Financials.
- For Healthcare, current valuation looks relatively attractive, and we like the lower beta2 exposure to the broad market in case we are transitioning to a period of slower growth in the coming quarters.
- For Materials, seasonal tailwinds (see Chart 2) should keep the sector supported in the coming months. Indeed, this sector tends to well between February and April.
- We continue to like Financials, but remain cautious given stretched valuations (as also noted in BMO Global Asset Management’s Sector Outlook for 2025). Our in-house systematic model also favours maintaining a long position for this sector (Chart 6), while our Fundamental team also endorses a long position in Financials.
Sectors We Like This Month
- Communications : BMO SPDR Communication Services Select Sector Index ETF – Series ETF (Ticker: ZXLC)
- Healthcare: BMO SPDR Health Care Select Sector Index ETF – Series ETF (Ticker: ZXLV)
- Financials: BMO SPDR Financials Select Sector Index ETF – Series ETF (Ticker: ZXLF)
Chart 1 – Momentum by Sector
Returns (%) |
|||||||
Index |
50-Day MAVG* |
100-Day MAVG* |
5-Day |
Month-to-Date |
Quarter-to-Date |
Year-to-Date |
|
| S&P 500 | 6054.61 |
5999.67 |
5927.69 |
-0.11% |
0.23% |
2.94% |
2.94% |
| Technology | 4584.38 |
4623.54 |
4560.36 |
1.24% |
2.46% |
-0.55% |
-0.55% |
| Communication Services | 365.05 |
352.97 |
337.32 |
-0.55% |
-1.96% |
6.85% |
6.85% |
| Financials | 854.17 |
926.38 |
810.85 |
-0.57% |
-0.20% |
6.18% |
6.18% |
| Utilities | 400.18 |
392.61 |
399.98 |
0.46% |
1.07% |
3.96% |
3.96% |
| Real Estate | 264.53 |
259.84 |
267.51 |
0.22% |
1.60% |
3.36% |
3.36% |
| Consumer Discretionary | 1827.03 |
1876.25 |
1767.22 |
-2.94% |
-4.42% |
-0.23% |
-0.23% |
| Energy | 697.44 |
676.60 |
690.80 |
1.66% |
4.42% |
6.50% |
6.50% |
| Industrials | 1169.12 |
1152.59 |
1160.90 |
0.69% |
-0.19% |
4.79% |
4.79% |
| Healthcare | 1698.69 |
1654.89 |
1696.03 |
-1.83% |
-0.71% |
5.85% |
5.85% |
| Consumer Staples | 894.01 |
865.23 |
870.99 |
1.71% |
2.80% |
4.73% |
4.73% |
| Materials | 561.11 |
550.04 |
573.06 |
0.07% |
0.37% |
5.92% |
5.92% |
*MAVG = moving average.3 Source: BMO Global Asset Management, as of February 12, 2025. For illustrative purposes only. Past performance is not indicative of future returns.
Chart 2 – Earnings and Valuation
Earnings |
Forward P/E |
||||
Expected (Year/Year %) |
Last Month |
Change (%) |
Next 12 Months |
Z-Score |
|
| S&P 500 | 14.43% |
14.99% |
-0.56% |
22.33 |
2.295 |
| Technology | 24.84% |
26.14% |
-1.30% |
28.86 |
1.711 |
| Communication Services | 22.39% |
19.43% |
2.96% |
18.57 |
1.168 |
| Financials | 14.82% |
8.38% |
6.44% |
15.81 |
1.971 |
| Utilities | 7.92% |
8.13% |
-0.21% |
17.84 |
1.145 |
| Real Estate | 4.82% |
5.78% |
-0.96% |
19.60 |
0.017 |
| Consumer Discretionary | 9.56% |
10.50% |
-0.94% |
28.94 |
2.111 |
| Energy | 19.40% |
-4.30% |
23.70% |
13.10 |
-0.328 |
| Industrials | 30.95% |
14.66% |
16.29% |
20.46 |
1.520 |
| Healthcare | 27.71% |
22.11% |
5.60% |
16.37 |
0.233 |
| Consumer Staples | 1.64% |
3.15% |
-1.51% |
22.12 |
2.121 |
| Materials | 8.85% |
16.13% |
-7.27% |
21.35 |
2.267 |
Source: BMO Global Asset Management. P/E refers to Price-to-Earnings Ratio, which analysts use as a valuation metric. The forward P/E ratio (or forward price-to-earnings ratio) divides the current share price of a company by the estimated future (“forward”) earnings per share (EPS) of that company. Z-Score is a measure of how much a data point varies from the average of the entire data set. A positive z-score says the data point is above average. A negative z-score says the data point is below average. The closer the Z-score is to zero, the closer the value is to the mean. As of February 5, 2025. For illustrative purposes only. Past performance is not indicative of future returns.
Chart 3 – Seasonality Chart (Average Return Over Past 35 Years)
January |
February |
March |
April |
May |
June |
July |
August |
September |
October |
November |
December |
|
S&P 500 |
0.60% |
0.08% |
1.18% |
1.56% |
1.00% |
0.00% |
1.44% |
-0.56% |
-0.84% |
1.44% |
2.23% |
1.24% |
Information Technology |
2.55% |
0.22% |
1.11% |
1.67% |
1.82% |
0.44% |
1.95% |
0.21% |
-1.33% |
2.57% |
3.11% |
0.57% |
Consumer Discretionary |
1.20% |
0.71% |
1.70% |
1.89% |
0.87% |
-0.12% |
1.41% |
-0.92% |
-0.97% |
1.17% |
3.14% |
1.18% |
Healthcare |
0.83% |
-0.55% |
0.54% |
1.20% |
1.39% |
0.77% |
1.32% |
-0.25% |
0.14% |
1.28% |
2.52% |
1.27% |
Consumer Staples |
-0.70% |
0.40% |
0.98% |
0.95% |
1.30% |
-0.28% |
1.25% |
-0.06% |
-0.55% |
2.20% |
2.06% |
1.15% |
Industrials |
0.14% |
0.59% |
1.36% |
1.84% |
0.72% |
-0.53% |
1.33% |
-0.90% |
-0.76% |
1.03% |
3.02% |
1.65% |
Financials |
0.60% |
0.04% |
0.80% |
1.98% |
1.15% |
-0.95% |
1.98% |
-0.92% |
-0.80% |
1.65% |
2.34% |
1.56% |
Communication Services |
0.23% |
-0.99% |
1.43% |
0.59% |
0.69% |
0.46% |
0.52% |
-1.40% |
0.22% |
0.84% |
1.66% |
1.67% |
Materials |
-0.36% |
1.10% |
1.44% |
2.60% |
0.69% |
-1.25% |
1.53% |
-1.18% |
-2.10% |
1.11% |
2.76% |
1.45% |
Real Estate |
0.20% |
-1.26% |
2.01% |
2.21% |
0.34% |
-0.50% |
2.93% |
0.49% |
-1.78% |
0.28% |
0.44% |
1.28% |
Utilities |
-0.26% |
-1.41% |
1.66% |
1.59% |
0.51% |
-0.49% |
0.87% |
0.29% |
-0.45% |
1.11% |
0.00% |
1.70% |
Energy |
0.30% |
0.85% |
1.55% |
3.61% |
0.36% |
-0.39% |
0.69% |
-1.30% |
0.08% |
0.88% |
0.76% |
0.77% |
Source: BMO Global Asset Management. As of February 5, 2025. For illustrative purposes only. Past performance is not indicative of future returns.
Chart 4 – The Current Expansionary Cycle Feels Like It’s Close to Maturation
| Current expansion (March 2023 - January 2025) | 22 months |
| April 2020 - June 2021 | 14 months |
| March 2016 - May 2018 | 26 months |
| September 2011 - September 2014 | 36 months |
| February 2009 - March 2011 | 25 months |
| April 2005 - July 2007 | 27 months |
| Average | 25 months |
Source: OECD, BMO Global Asset Management. As of February 5, 2025. For illustrative purposes only.
Chart 5 – Sensitivity to Macro Securities
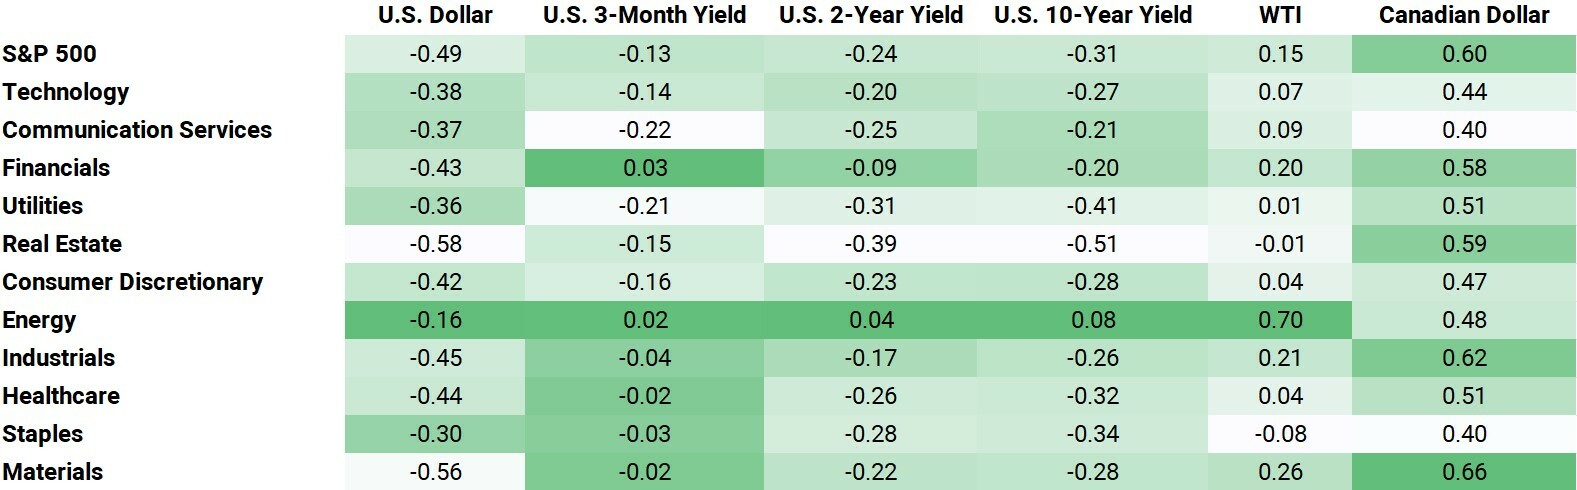
*Correlation4 over last 150 weekly observations. Source: BMO Global Asset Management. As of February 5, 2025. For illustrative purposes only. Past performance is not indicative of future returns.
Chart 6 – BMO Global Asset Management Quant Model
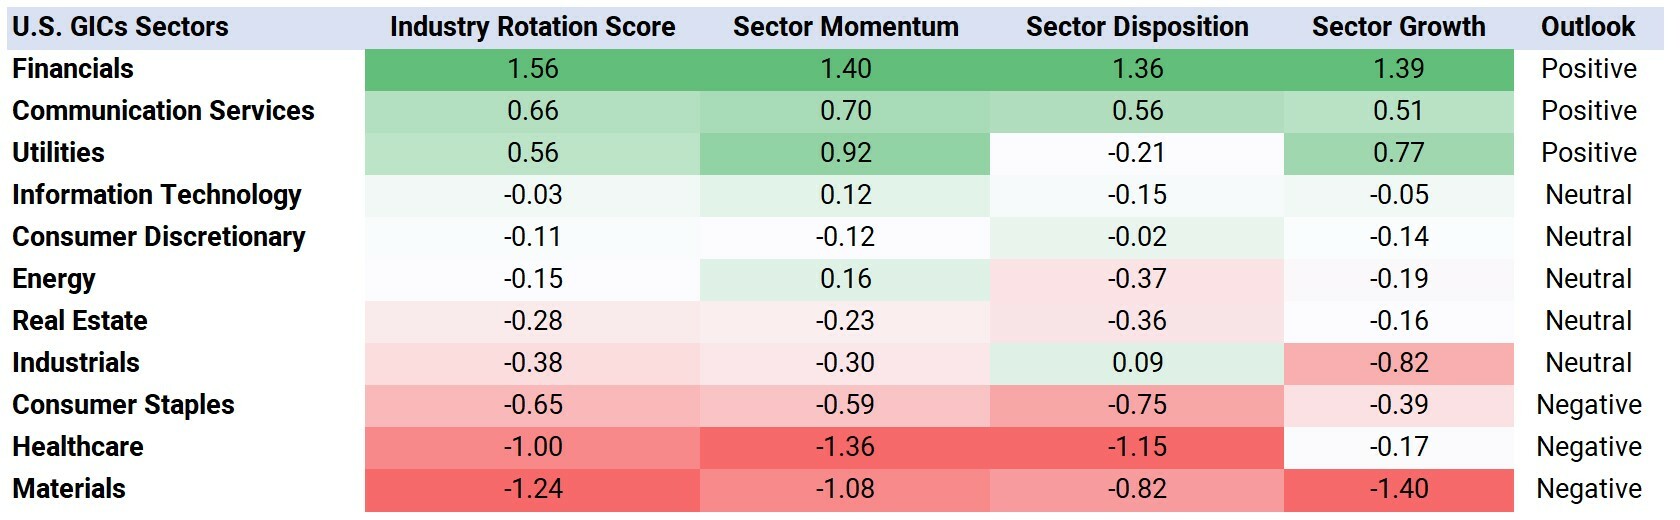
Source: BMO Global Asset Management. Note: Industry Rotation Score = a measure that uses momentum, disposition and growth as inputs to identify potential rotation opportunities. Scale is from -3 to +3, with the higher score indicating a more positive outlook. As of February 5, 2025. For illustrative purposes only. Past performance is not indicative of future returns.
Definitions:
1 Leading Indicator: A measurable set of data that may help to forecast future economic activity.
2 Beta: A measure of the volatility, or systematic risk, of a security or a portfolio in comparison to the market as a whole.
3 Moving Average: The average price of an asset during specified periods, often used by analysts to identify trends.
4 Correlation: A statistical measure of how two securities move in relation to one another. Positive correlation indicates similar movements, up or down together, while negative correlation indicates opposite movements (when one rises, the other falls).
Disclaimers:
Any statement that necessarily depends on future events may be a forward-looking statement. Forward-looking statements are not guarantees of performance. They involve risks, uncertainties and assumptions. Although such statements are based on assumptions that are believed to be reasonable, there can be no assurance that actual results will not differ materially from expectations. Investors are cautioned not to rely unduly on any forward-looking statements. In connection with any forward-looking statements, investors should carefully consider the areas of risk described in the most recent simplified prospectus.
This is for information purposes only. The information contained herein is not, and should not be construed as investment, tax or legal advice to any party. Particular investments and/or trading strategies should be evaluated relative to the individual’s investment objectives and professional advice should be obtained with respect to any circumstance.
You cannot invest directly in an index.
Sector ETF products are also subject to sector risk and non-diversification risk, which generally will result in greater price fluctuations than the overall market.
The Select Sector SPDR Trust consists of eleven separate investment portfolios (each a“Select Sector SPDR ETF” or an“ETF” and collectively the“Select Sector SPDR ETFs” or the“ETFs”). Each Select Sector SPDR ETF is an“index fund” that invests in a particular sector or group of industries represented by a specified Select Sector Index. The companies included in each Select Sector Index are selected on the basis of general industry classification from a universe of companies defined by the S&P 500®. The investment objective of each ETF is to provide investment results that, before expenses, correspond generally to the price and yield performance of publicly traded equity securities of companies in a particular sector or group of industries, as represented by a specified market sector index.
The S&P 500, SPDRs, and Select Sector SPDRs are trademarks of The McGraw-Hill Companies, Inc. and have been licensed for use. The stocks included in each Select Sector Index were selected by the compilation agent. Their composition and weighting can be expected to differ to that in any similar indexes that are published by S&P.
The S&P 500 Index is an unmanaged index of 500 common stocks that is generally considered representative of the U.S. stock market. The index is heavily weighted toward stocks with large market capitalizations and represents approximately two-thirds of the total market value of all domestic common stocks. The S&P 500 Index figures do not reflect any fees, expenses or taxes. An investor should consider investment objectives, risks, fees and expenses before investing.
Commissions, management fees and expenses all may be associated with investments in exchange traded funds. Please read the ETF Facts or simplified prospectus of the BMO ETFs before investing. Exchange traded funds are not guaranteed, their values change frequently and past performance may not be repeated.
For a summary of the risks of an investment in the BMO ETFs, please see the specific risks set out in the simplified prospectus. BMO ETFs trade like stocks, fluctuate in market value and may trade at a discount to their net asset value, which may increase the risk of loss. Distributions are not guaranteed and are subject to change and/or elimination.
BMO ETFs are managed by BMO Asset Management Inc., which is an investment fund manager and a portfolio manager, and a separate legal entity from Bank of Montreal.
BMO Global Asset Management is a brand name under which BMO Asset Management Inc. and BMO Investments Inc. operate.
“BMO (M-bar roundel symbol)” is a registered trademark of Bank of Montreal, used under licence.