Why Tariffs Are Becoming Mainstream – and What to Do About It


Despite the uncertainty surrounding implementation or which products and sectors could be included or exempted, tariffs are likely to gain broader acceptance at all levels of government in the United States in the period ahead.
Indeed, there is a compelling reason for Republicans in both chambers of Congress to consider tariffs to solve an important problem. Namely, that the ability to extend tax cuts while trimming the bloated budget deficit looks increasingly untenable without tariff-related revenues.
In this note, we’ll quickly rehash the current state of affairs when it comes to the budget resolution process that is underway in both the House of Representatives and the Senate. Then we’ll go over why it may become difficult to extricate tariffs from tax cuts over the coming months – even if there are additional tariff delays from the White House.
Finally, we offer three takeaways for our readers as well as ideas to take advantage of an environment where tariffs become a more permanent fixture.
What is the underlying issue?
Fundamentally, it boils down to the following: Republicans want to extend prior tax cuts, address Trump’s campaign pledges, and at the same time, shrink the size of the fiscal deficit over the coming years.
Currently, GOP members in both chambers of congress (the House of Representatives and the Senate) have been working separately towards a budget resolution. The focus of this process is how to make permanent, or at least extend, the tax cuts that were initiated in Trump’s first term and are due to expire towards the end of this year. If you recall, these are the cuts implemented as part of the 2017 Tax Cuts and Jobs Act (or the TCJA).
Besides an extension of the TCJA tax cuts, what are the other priorities for Trump?
You’ll recognize a few of them from the campaign trail:
- No taxes on tips (which is estimated to cost US$100bln over the next 10 years).
- No taxes on overtime pay (US$250 billion over the next 10 years).
- No taxes on social security benefits (US$550 billion)
- Lower taxes on firms that make their products in the U.S. (US$100 billion)
- Adjusting the US$10,000 cap on deductions for state and local taxes (SALT)
- Additional spending on defense and border spending (US$300 billion)
Where are we at now?
Despite some discomfort amongst fiscal hawks, House Republicans passed a procedural bill that includes US$4.5trln in tax breaks and US$2trln in spending cuts over the next 10 years. Additionally, the bill does call for about US$300bln in support for border enforcement and defense alongside a $4trln increase in the debt limit.
Meanwhile, the Senate passed its own competing bill earlier in February. That means that GOP members in both chambers will now begin to work together to reconcile the significant differences between the two bills ahead of the government funding deadline on March 14.
What are the speedbumps ahead for the GOP?
The House GOP blueprint does not include details as to which taxes will be cut, nor does it specify which programs will be slashed. For the latter, in the past, top Republicans have indicated that they would target Medicaid and the Supplementary Nutrition Assistance Program (or SNAP). However, cutting either of those is a very thorny political issue for Trump given that a significant part of his base benefits from both programs.
As part of the House GOP plan, if there are problems finding US$2trln in spending to eliminate, the allowance for tax cuts will shrink by the same shortfall. For instance, if there’s only US$1trln in spending that can be cut, then the budget for tax cuts will shrink to US$3.5trln. By most estimates, that amount would not be enough to cover even an extension of the TCJA tax cuts.
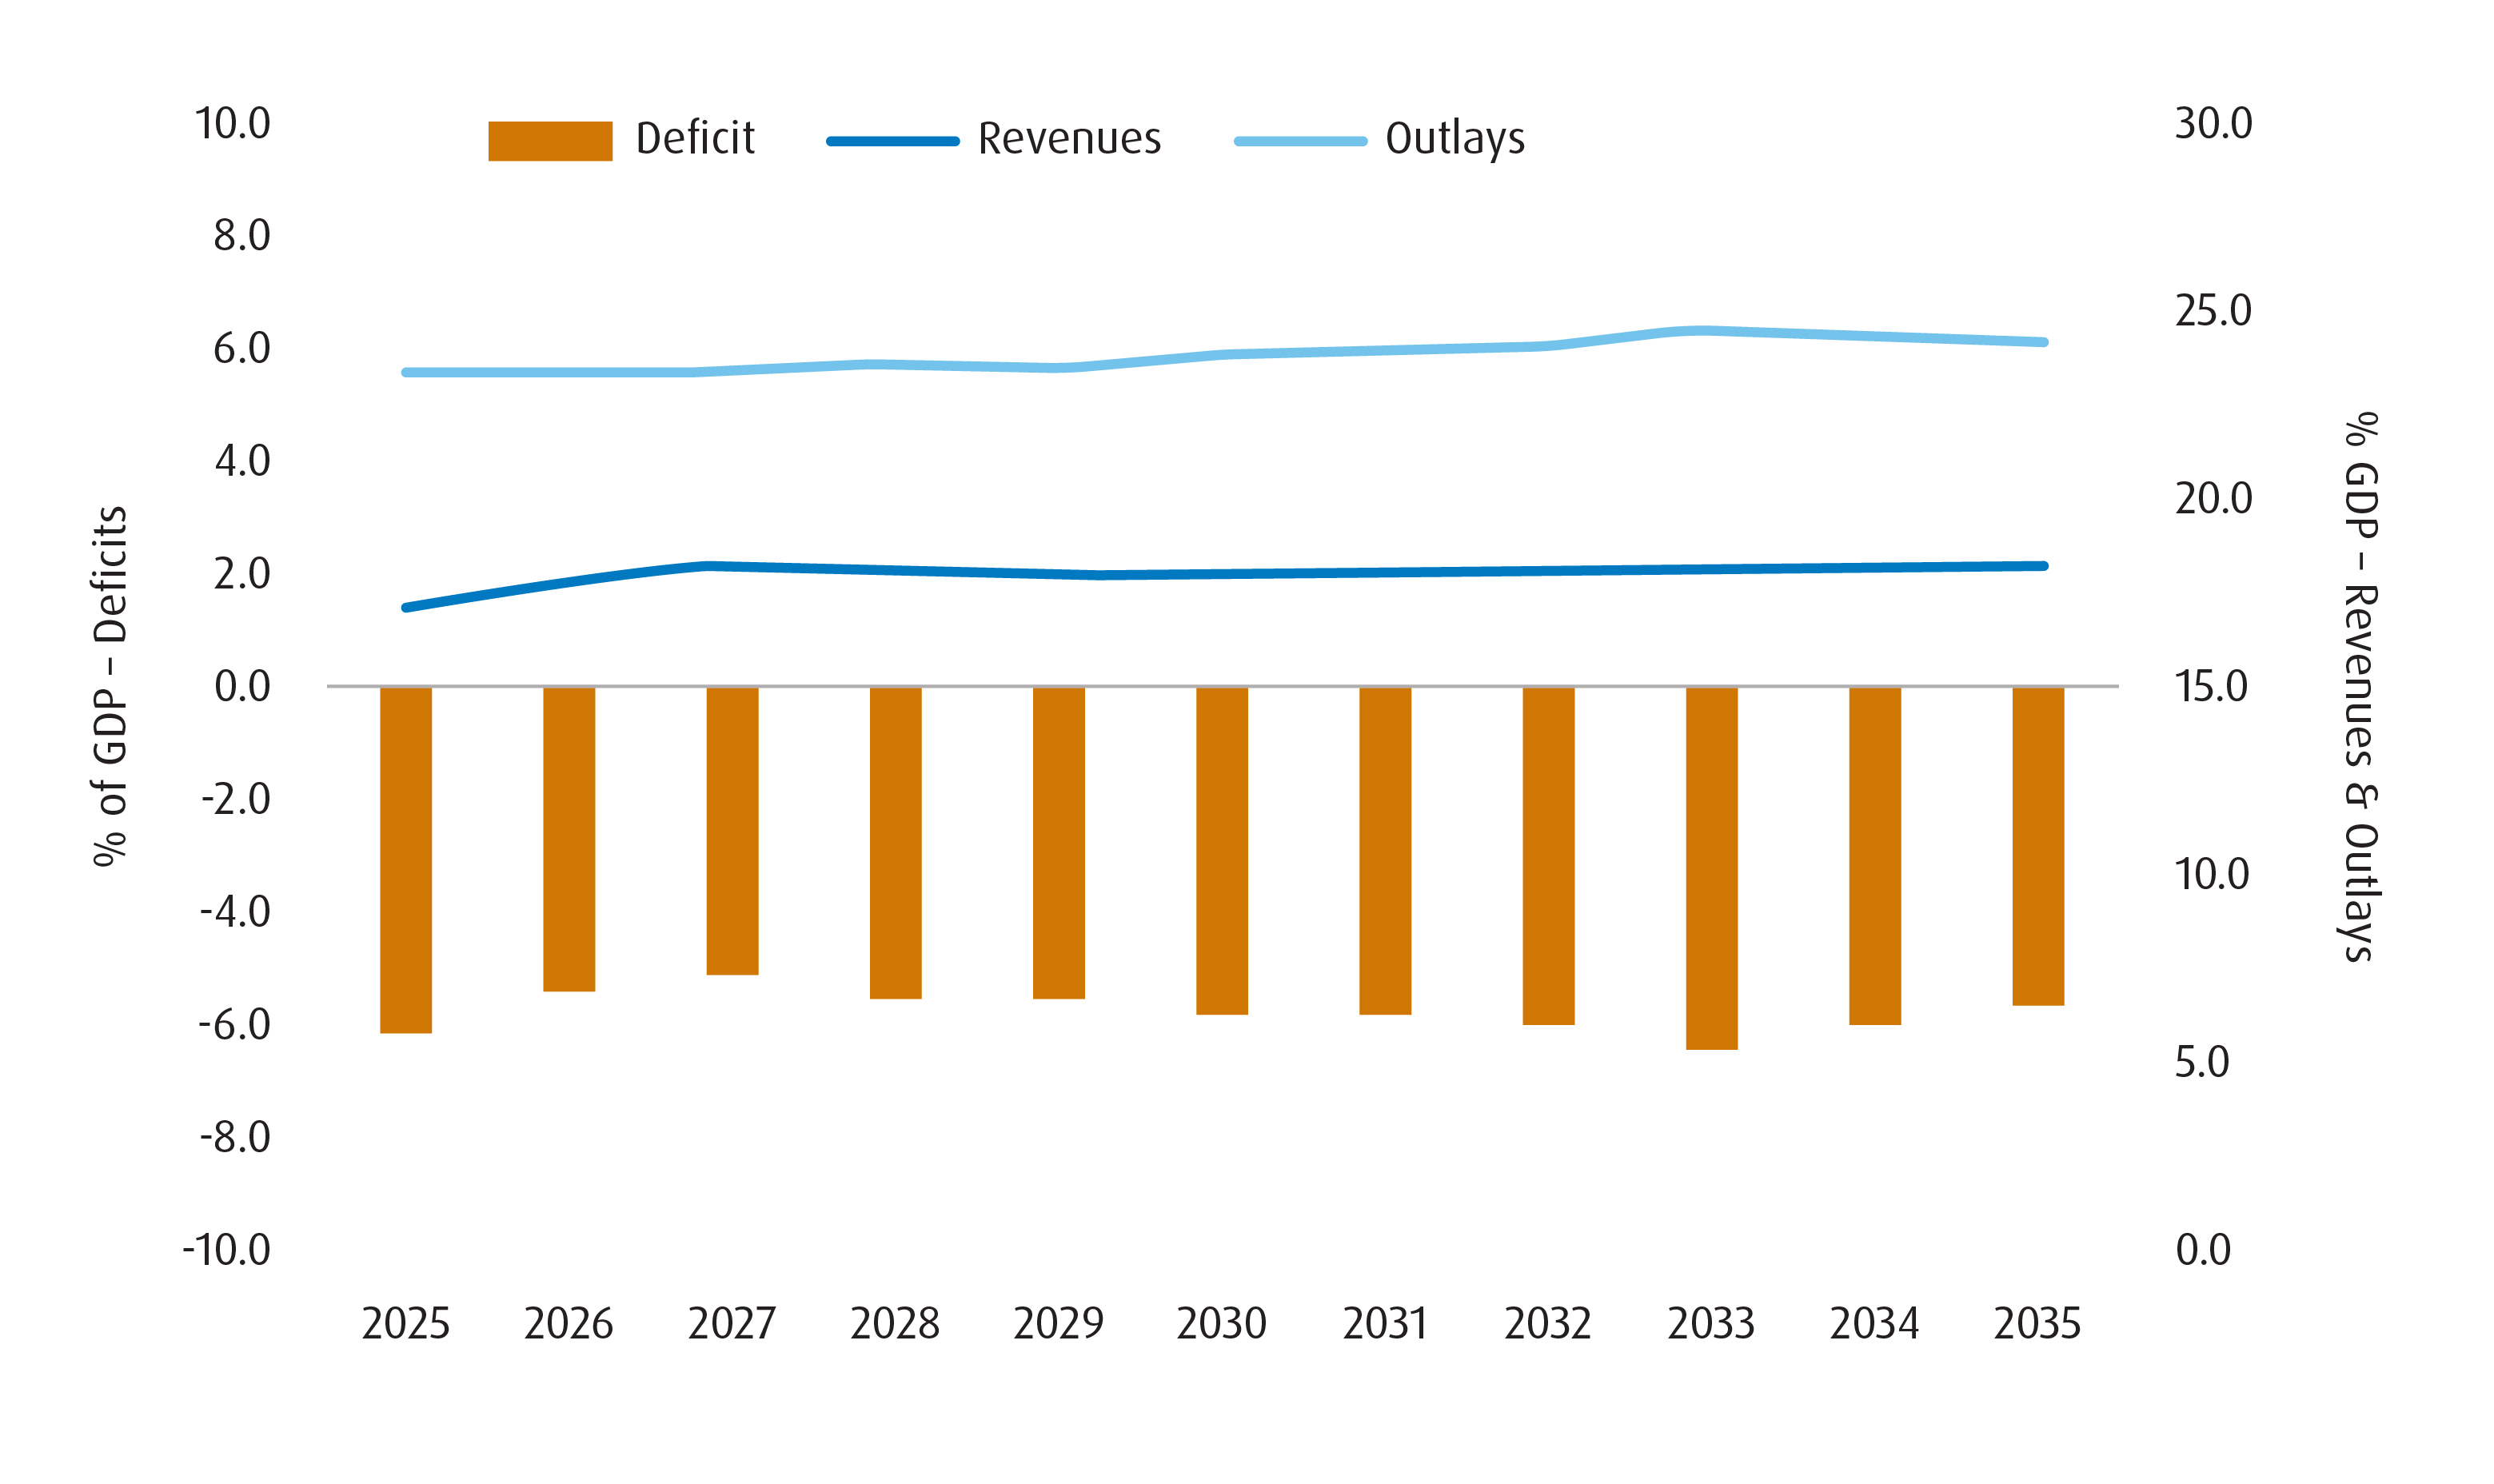
Additionally, the House GOP bill could add at least US$2.8trln to the deficit over the next ten years. Chart 1 shows the current budget projections – which show the sizeable scale of deficits even before we consider the House GOP proposal.
Chart 1 – Current Budget Projections (% of GDP) for the Next Ten Years
Are there any potential roadblocks in the Senate?
Like the House GOP, the Senate would like to see a bill comprised of tax cuts, deregulation of fossil fuel production and enhancement of border security. The issue is that the Senate doesn’t just want an extension of the TCJA cuts – but to make them permanent. That would potentially cost more than the US$4.5trln upper limit that the House bill has proposed so far.
What’s more is that the GOP only holds 53 seats in the Senate, and that they need 67 votes to bypass the Democrat filibuster on any bill. They can circumvent this requirement through a process known as ‘reconciliation’ – which would mean only a simple majority (51 votes) is required to pass a bill. However, there are a few constraints with reconciliation:
- First, only items impacting the budget balance can be included.
- Second, the 10-year deficit outlook must be unchanged.
In other words, the full cost of extending the tax cuts (US$4.5trln) has to be offset by spending cuts and/or new sources of revenue.
Why does this all matter?
At the very least, if the revised budget isn’t large enough to incorporate an extension in tax cuts, then the appeal of using tariff revenues as part of the projection process increases. That should correspond to an uptick in congressional enthusiasm for tariffs to achieve their aims.
And this matters a great deal when you consider the deadlines that are approaching. For instance, the date for the 25% comprehensive tariffs on Canada and Mexico is still March 4 (at the time of publication). Additionally, the steel and aluminum tariffs are still slated to go into effect on March 12.
If we do start seeing a greater reliance on tariffs for revenue projections coming out of House/Senate negotiations, then it stands to reason that diplomatic efforts to get them rescinded will be much tougher.
How do we game plan?
If there is a groundswell of support for tariffs at the congressional level, then there’s a decent chance that tariffs are a permanent part of the picture when it comes to U.S. trade.
For us, there are three takeaways. First, we’d expect the Bank of Canada (BoC) to cut the overnight rate into stimulative territory. True, there may be near-term concerns about the passthrough of a weaker Canadian dollar (CAD) and retaliatory tariffs on the domestic inflation profile, but those should give way eventually to the long-term effects of a decline in potential growth and productivity. The latter two point to disinflation,2 rather than inflation, as being the more important risk. That suggests additional upside for products that closely track Canadian government bond yields including the BMO Short Federal Bond Index ETF (Ticker: ZFS) and the BMO Government Bond Index ETF (Ticker: ZGB).
Chart 2 – ZGB Tracks the Market Pricing for the BoC Terminal Rate3
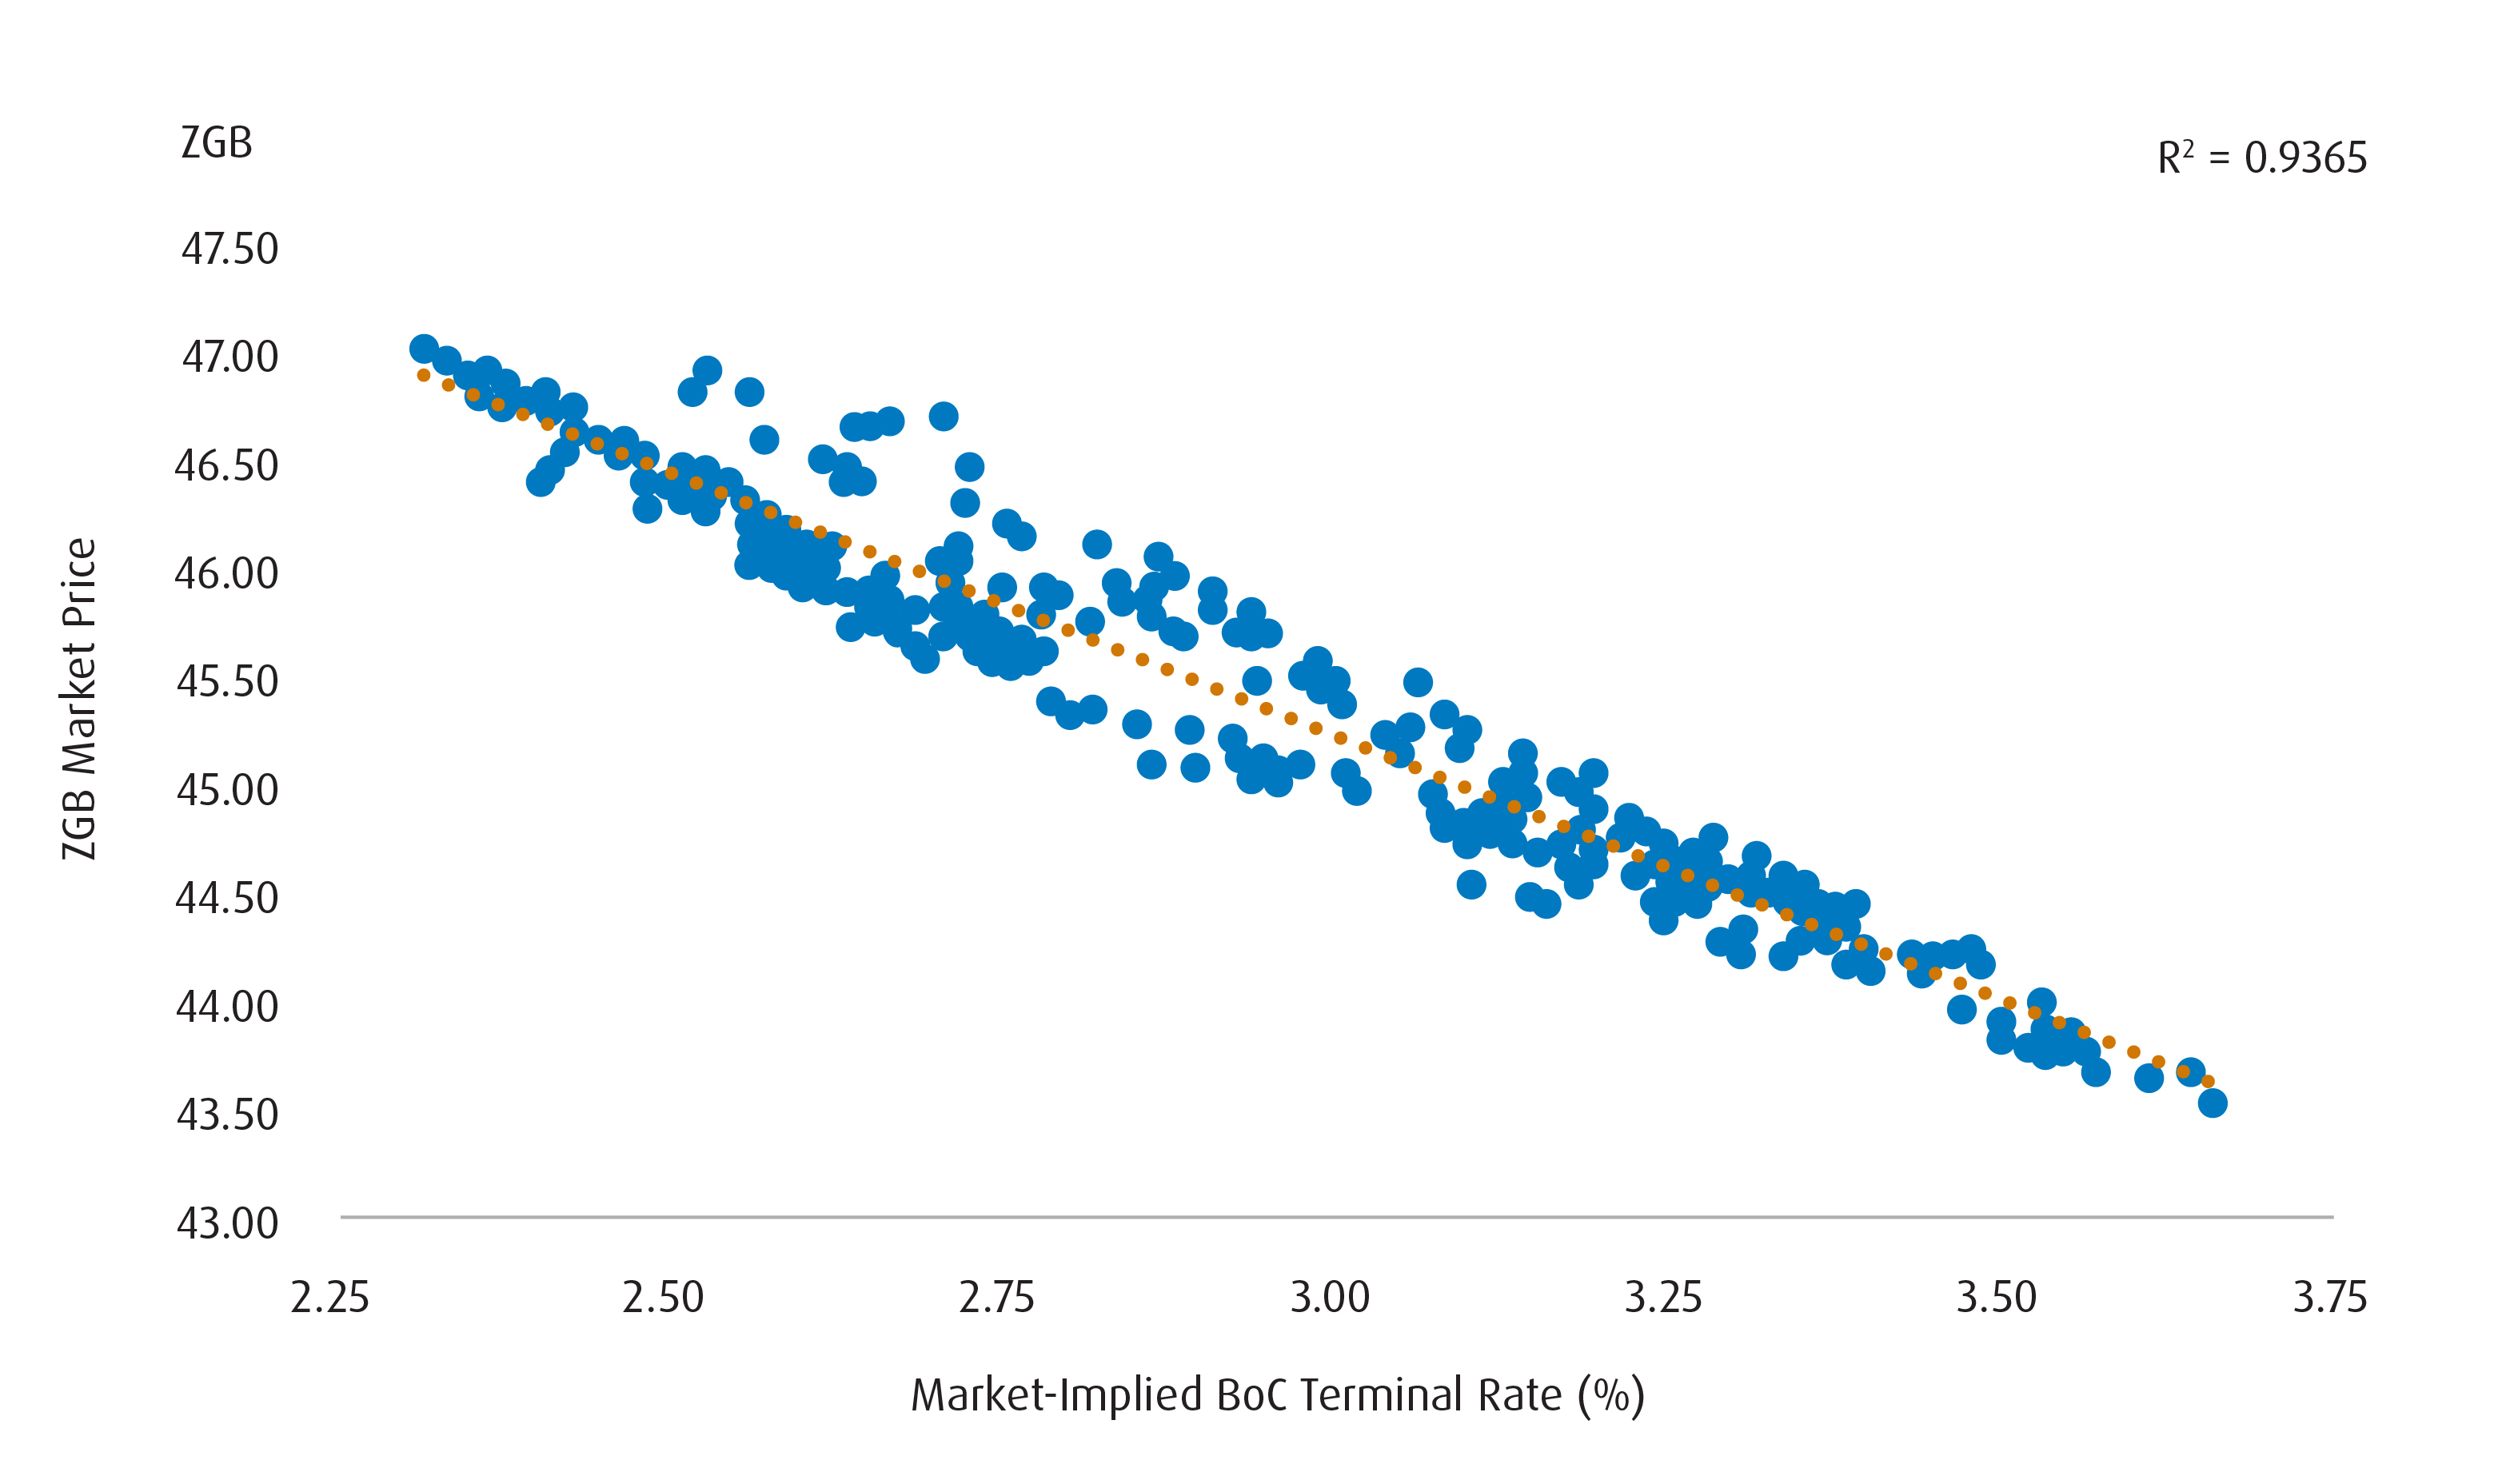
Source: BMO Global Asset Management, January 24, 2024-February 21, 2025.
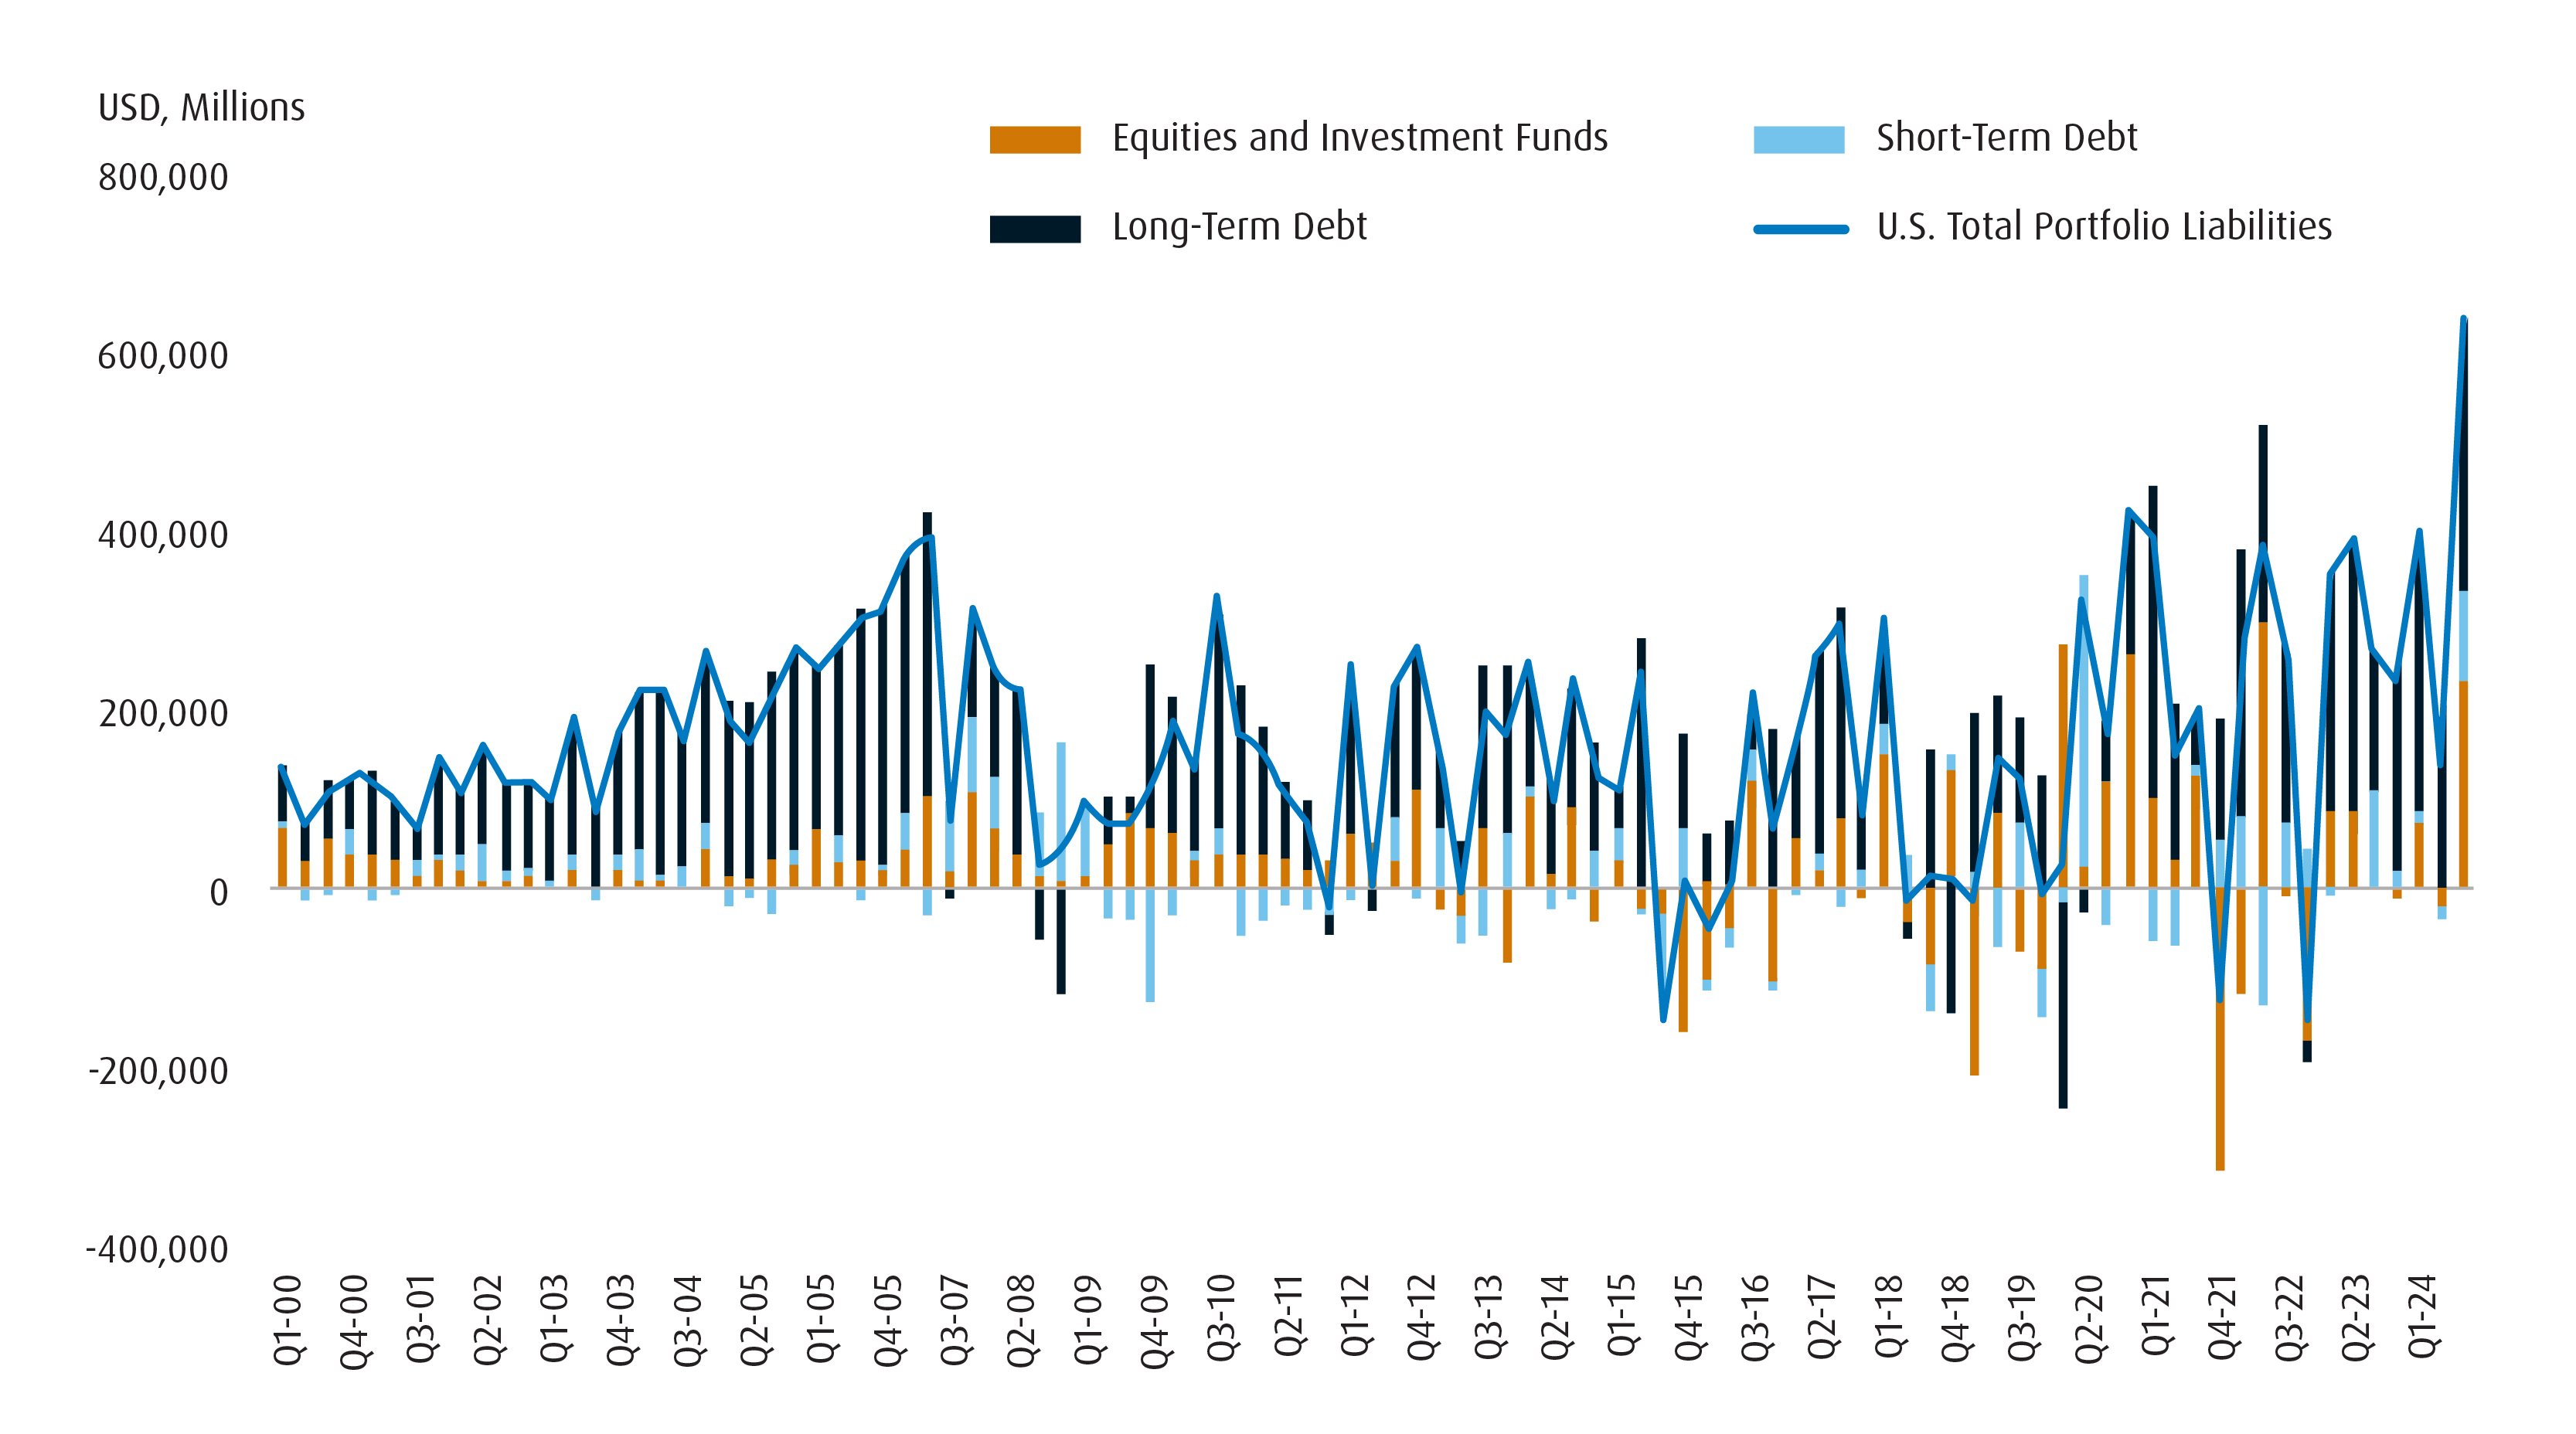
Second, we’d expect to see international investors vote with their feet. U.S. markets have benefitted greatly from an influx of foreign portfolio flows. However, the unpredictability of Trump’s policies and a reliance on tariffs could lead to risks that shift into the realm of financing. The overvalued nature of the U.S. market, alongside the undervalued nature of other markets, implies that this remains an acute risk. That creates an investment thesis for products like the BMO MSCI EAFE Index ETF (Ticker: ZEA) and the BMO Gold Bullion ETF (Ticker: ZGLD).
Chart 3 – The U.S. Markets Rely Heavily on Foreign Funding
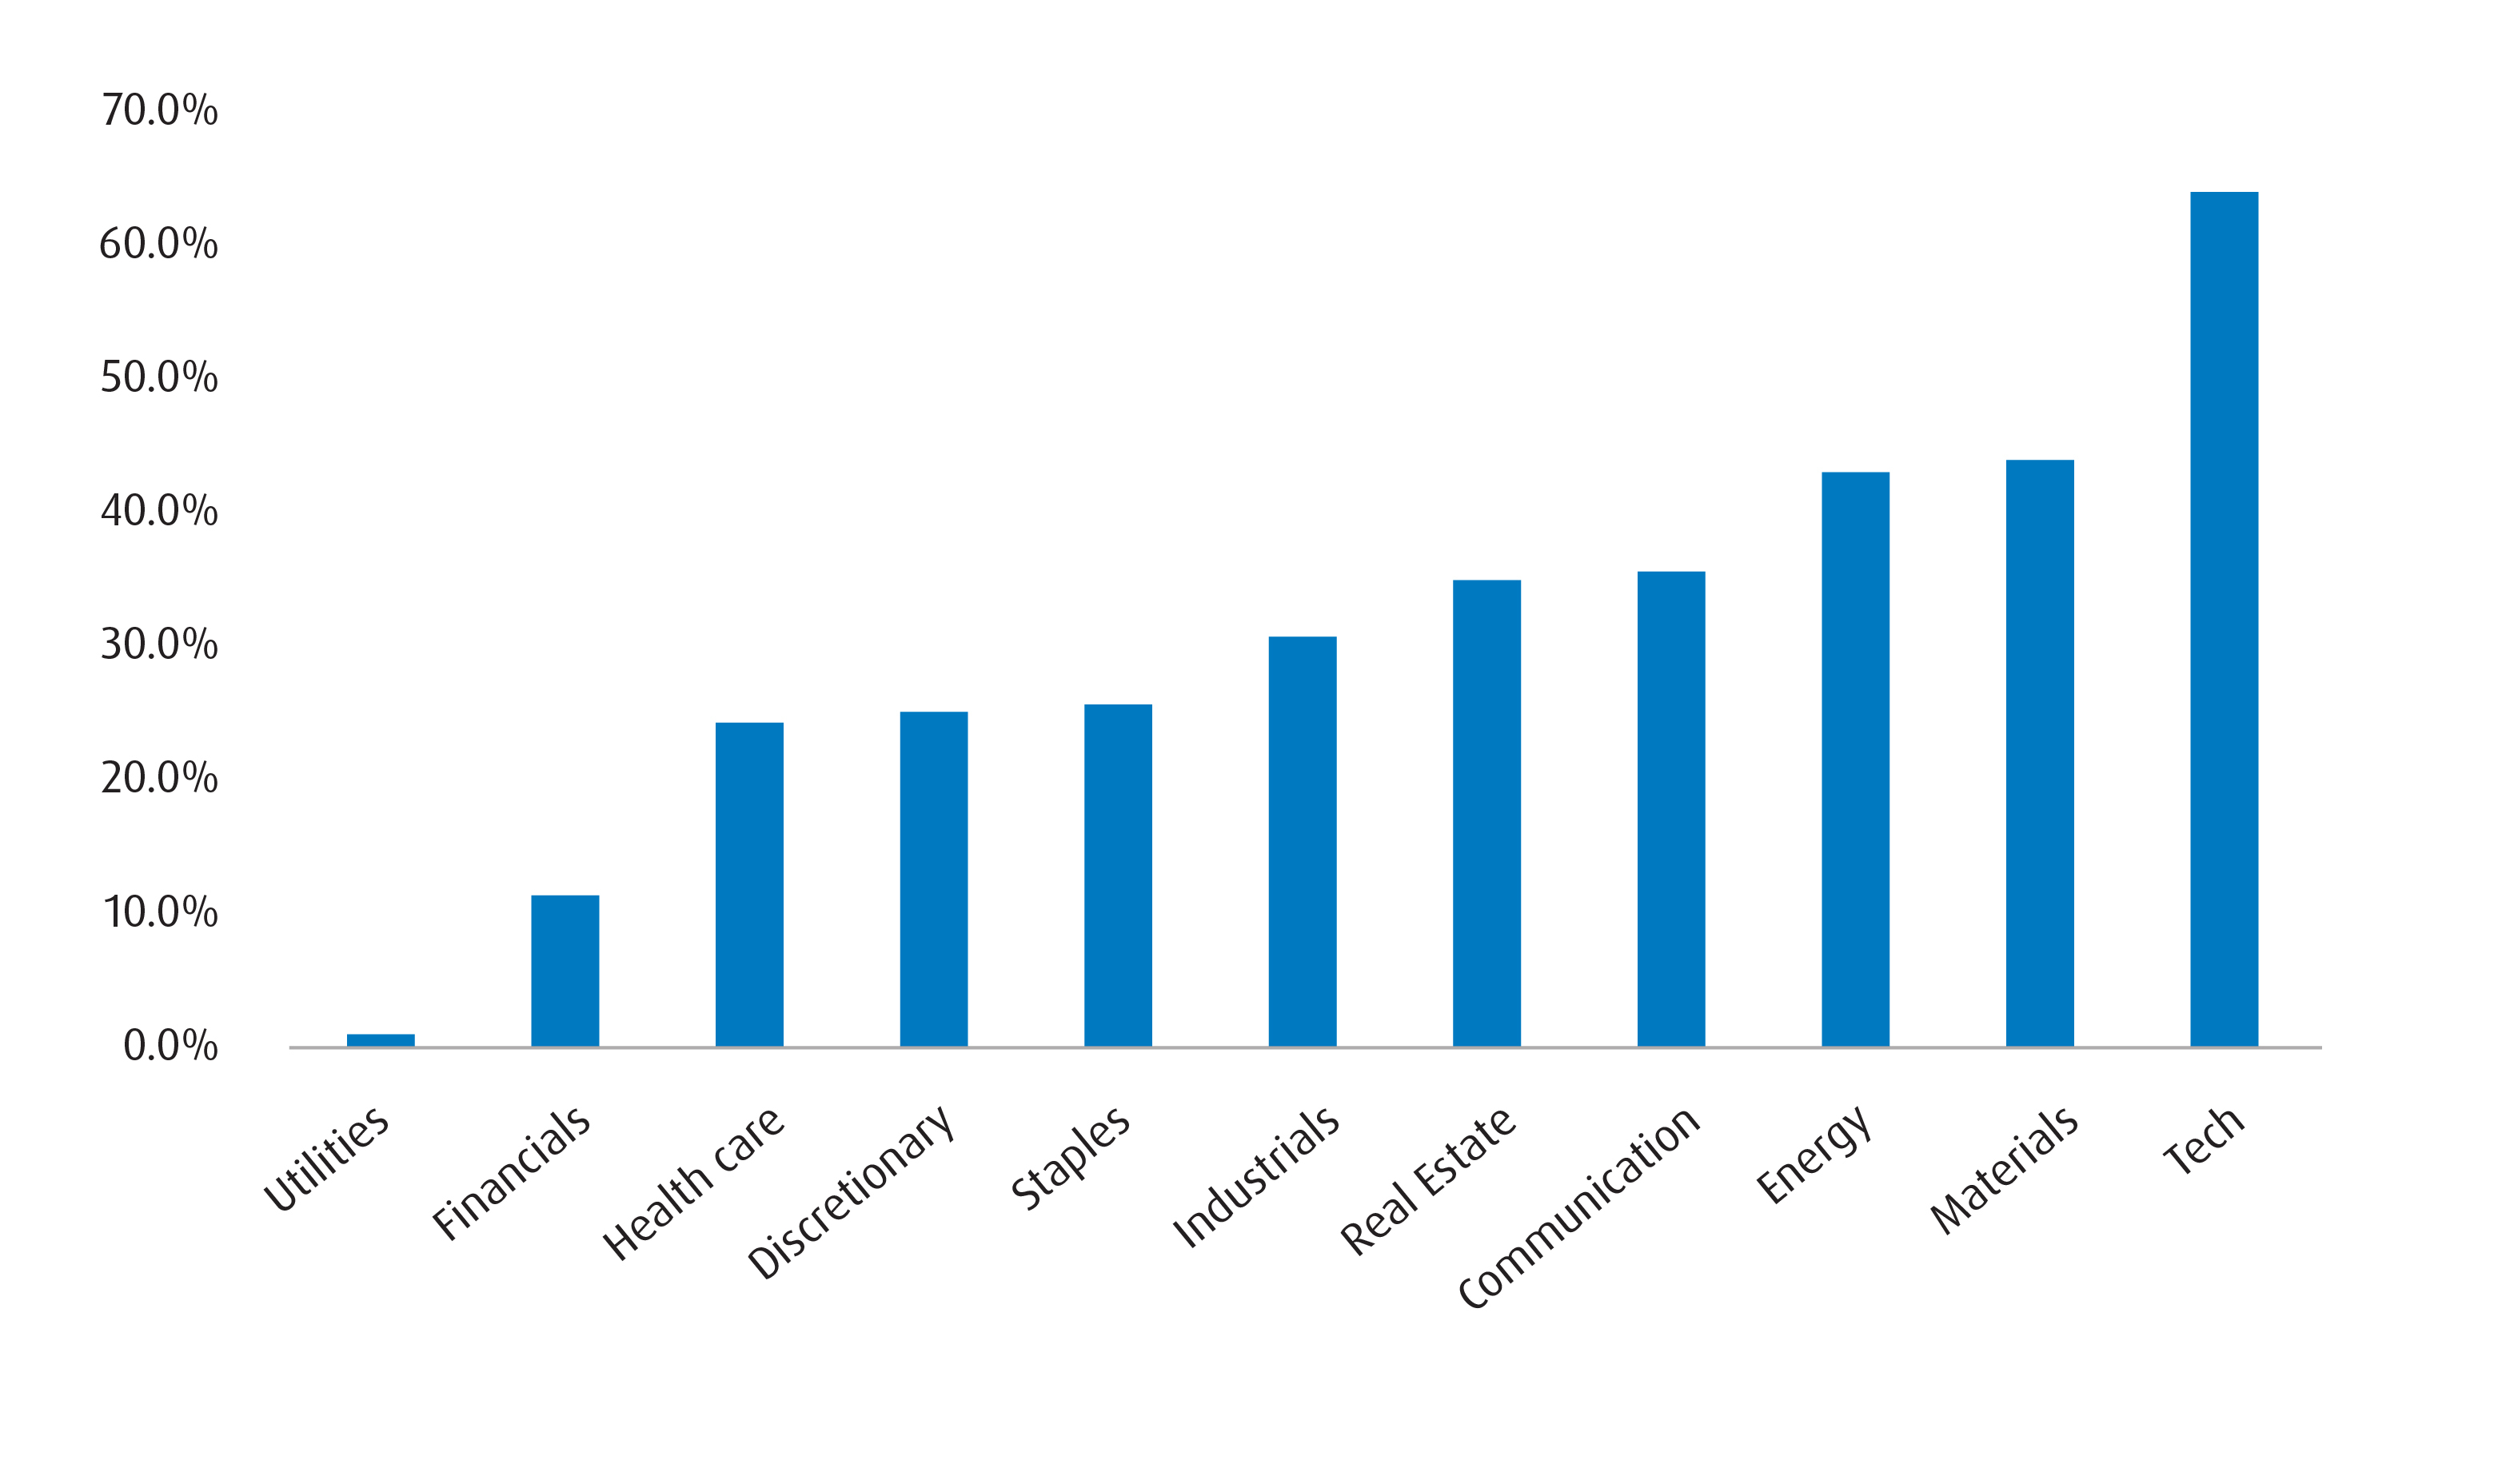
Third, tariffs and retaliatory measures will leave certain sectors more exposed than others. For instance, Technology and Materials are particularly exposed given the degree of revenues that are earned outside of the U.S. Meanwhile, sectors such as Utilities and Healthcare should be relatively sheltered given the majority of revenues are earned within the U.S. As such, we continue to remain overweight healthcare via the BMO SPDR Health Care Select Sector Index ETF (Ticker: ZXLV) and will also look at the BMO SPDR Utilities Select Sector Index ETF (Ticker: ZXLU).
Chart 4 – Percentage of Non-US Revenues by Sector
More than anything, we’d encourage investors to remain flexible in their thinking and nimble when it comes to allocations. After all, we get the sense that support for tariffs in the United States has never been higher, and quite frankly, we will all be navigating this new era together for the first time.
Performance (%):
Year-to-Date |
1-Month |
3-Month |
6-Month |
1-Year |
3-Year |
5-Year |
10-Year |
Since Inception |
|
0.84 |
0.84 |
1.58 |
2.90 |
5.82 |
1.98 |
1.41 |
1.12 |
1.63 |
|
1.23 |
1.23 |
2.00 |
2.98 |
6.18 |
0.19 |
-0.17 |
- |
1.55 |
|
6.21 |
6.21 |
6.24 |
5.43 |
17.68 |
9.17 |
8.10 |
7.00 |
7.51 |
|
Returns are not available as there is less than one year’s performance data. |
|||||||||
Returns are not available as there is less than one year’s performance data. |
|||||||||
Returns are not available as there is less than one year’s performance data. |
|||||||||
Bloomberg, as of January 31, 2025. Inception date for ZFS = October 20, 2009, ZGB = March 2, 2018, ZEA = February 10, 2014 , ZGLD = March 4, 2024 , ZXLV, ZXLU = February 3, 2025.
1 The debt ceiling is the maximum amount of debt that the U.S. government can have. It’s also known as the debt limit.
2 Disinflation is when the rate of inflation slows down, but prices are still increasing. For example, if inflation decreases from 8% to 6%.
3 The terminal federal funds rate is the ultimate interest rate level that the central bank sets as a target for a cycle of rate hikes or cuts. It is the longer-term target rate at which prices are stable and full employment is achieved (sometimes called the neutral rate).
Disclaimers:
Changes in rates of exchange may also reduce the value of your investment.
The communication is for information purposes. The information contained herein is not, and should not be construed as, investment, tax or legal advice to any party. Particular investments and/or trading strategies should be evaluated relative to the individual’s investment objectives and professional advice should be obtained with respect to any circumstance.
The viewpoints expressed by the author represents their assessment of the markets at the time of publication. Those views are subject to change without notice at any time. The information provided herein does not constitute a solicitation of an offer to buy, or an offer to sell securities nor should the information be relied upon as investment advice. Past performance is no guarantee of future results. This communication is intended for informational purposes only.
Any statement that necessarily depends on future events may be a forward-looking statement. Forward-looking statements are not guarantees of performance. They involve risks, uncertainties and assumptions. Although such statements are based on assumptions that are believed to be reasonable, there can be no assurance that actual results will not differ materially from expectations. Investors are cautioned not to rely unduly on any forward-looking statements. In connection with any forward-looking statements, investors should carefully consider the areas of risk described in the most recent prospectus.
The ETF referred to herein is not sponsored, endorsed, or promoted by MSCI and MSCI bears no liability with respect to the ETF or any index on which such ETF is based. The ETF’s prospectus contains a more detailed description of the limited relationship MSCI has with the Manager and any related ETF.
Commissions, management fees and expenses all may be associated with investments in exchange traded funds. Please read the ETF Facts or simplified prospectus of the BMO ETFs before investing. Exchange traded funds are not guaranteed, their values change frequently and past performance may not be repeated.
For a summary of the risks of an investment in the BMO ETFs, please see the specific risks set out in the BMO ETF’s simplified prospectus. BMO ETFs trade like stocks, fluctuate in market value and may trade at a discount to their net asset value, which may increase the risk of loss. Distributions are not guaranteed and are subject to change and/or elimination.
BMO ETFs are managed by BMO Asset Management Inc., which is an investment fund manager and a portfolio manager, and a separate legal entity from Bank of Montreal.
BMO Global Asset Management is a brand name under which BMO Asset Management Inc. and BMO Investments Inc. operate.
“BMO (M-bar roundel symbol)” is a registered trademark of Bank of Montreal, used under licence.
February 25, 2025