Why You Should Consider Increasing Your FX Hedges


Into 2025, one of the more pressing questions for Canadian investors is whether or not to hedge FX exposure to U.S. assets from here.
Yes, we understand that this might sound crazy. Not least as it’s almost inevitable now that Trump will immediately levy 25% tariffs against all Canadian exports once he’s inaugurated on January 20. However, our contention isn’t that Trump is going to have a change of heart – it’s that the market is likely pricing this in as a near certainty already. That has meaningful implications for portfolios going forward.
Why do we get the sense that the market has already fleshed out this theme? Well, one can get an idea by looking at proxies of positioning in the FX space – namely in the futures market.
Recall, that getting an accurate feel for positioning in an over-the-counter (OTC) market like FX is notoriously difficult because of its sheer size, and the lack of frequent, centralized data. The best we have is a triennial survey conducted by the Bank for International Settlements (or BIS), but this data is compiled and released every three years. Data from some brokers and settlement service providers can be helpful, but is also released with a lag of a few months. That means there’s little practical use for them when it comes to investing decisions.
Nevertheless, there’s good reason to suspect that trends in currency positions tend to correlate between different instruments. What’s more is that we can get a sense of the scale of positioning as well. For instance, if positioning in the futures market suggests that net non-commercial investors (or those that are speculating on currency movements using futures) have built up the largest short Canadian dollar (CAD) position in years, then there’s a good chance that speculators are using larger and more liquid FX instruments (spot, options), as well.
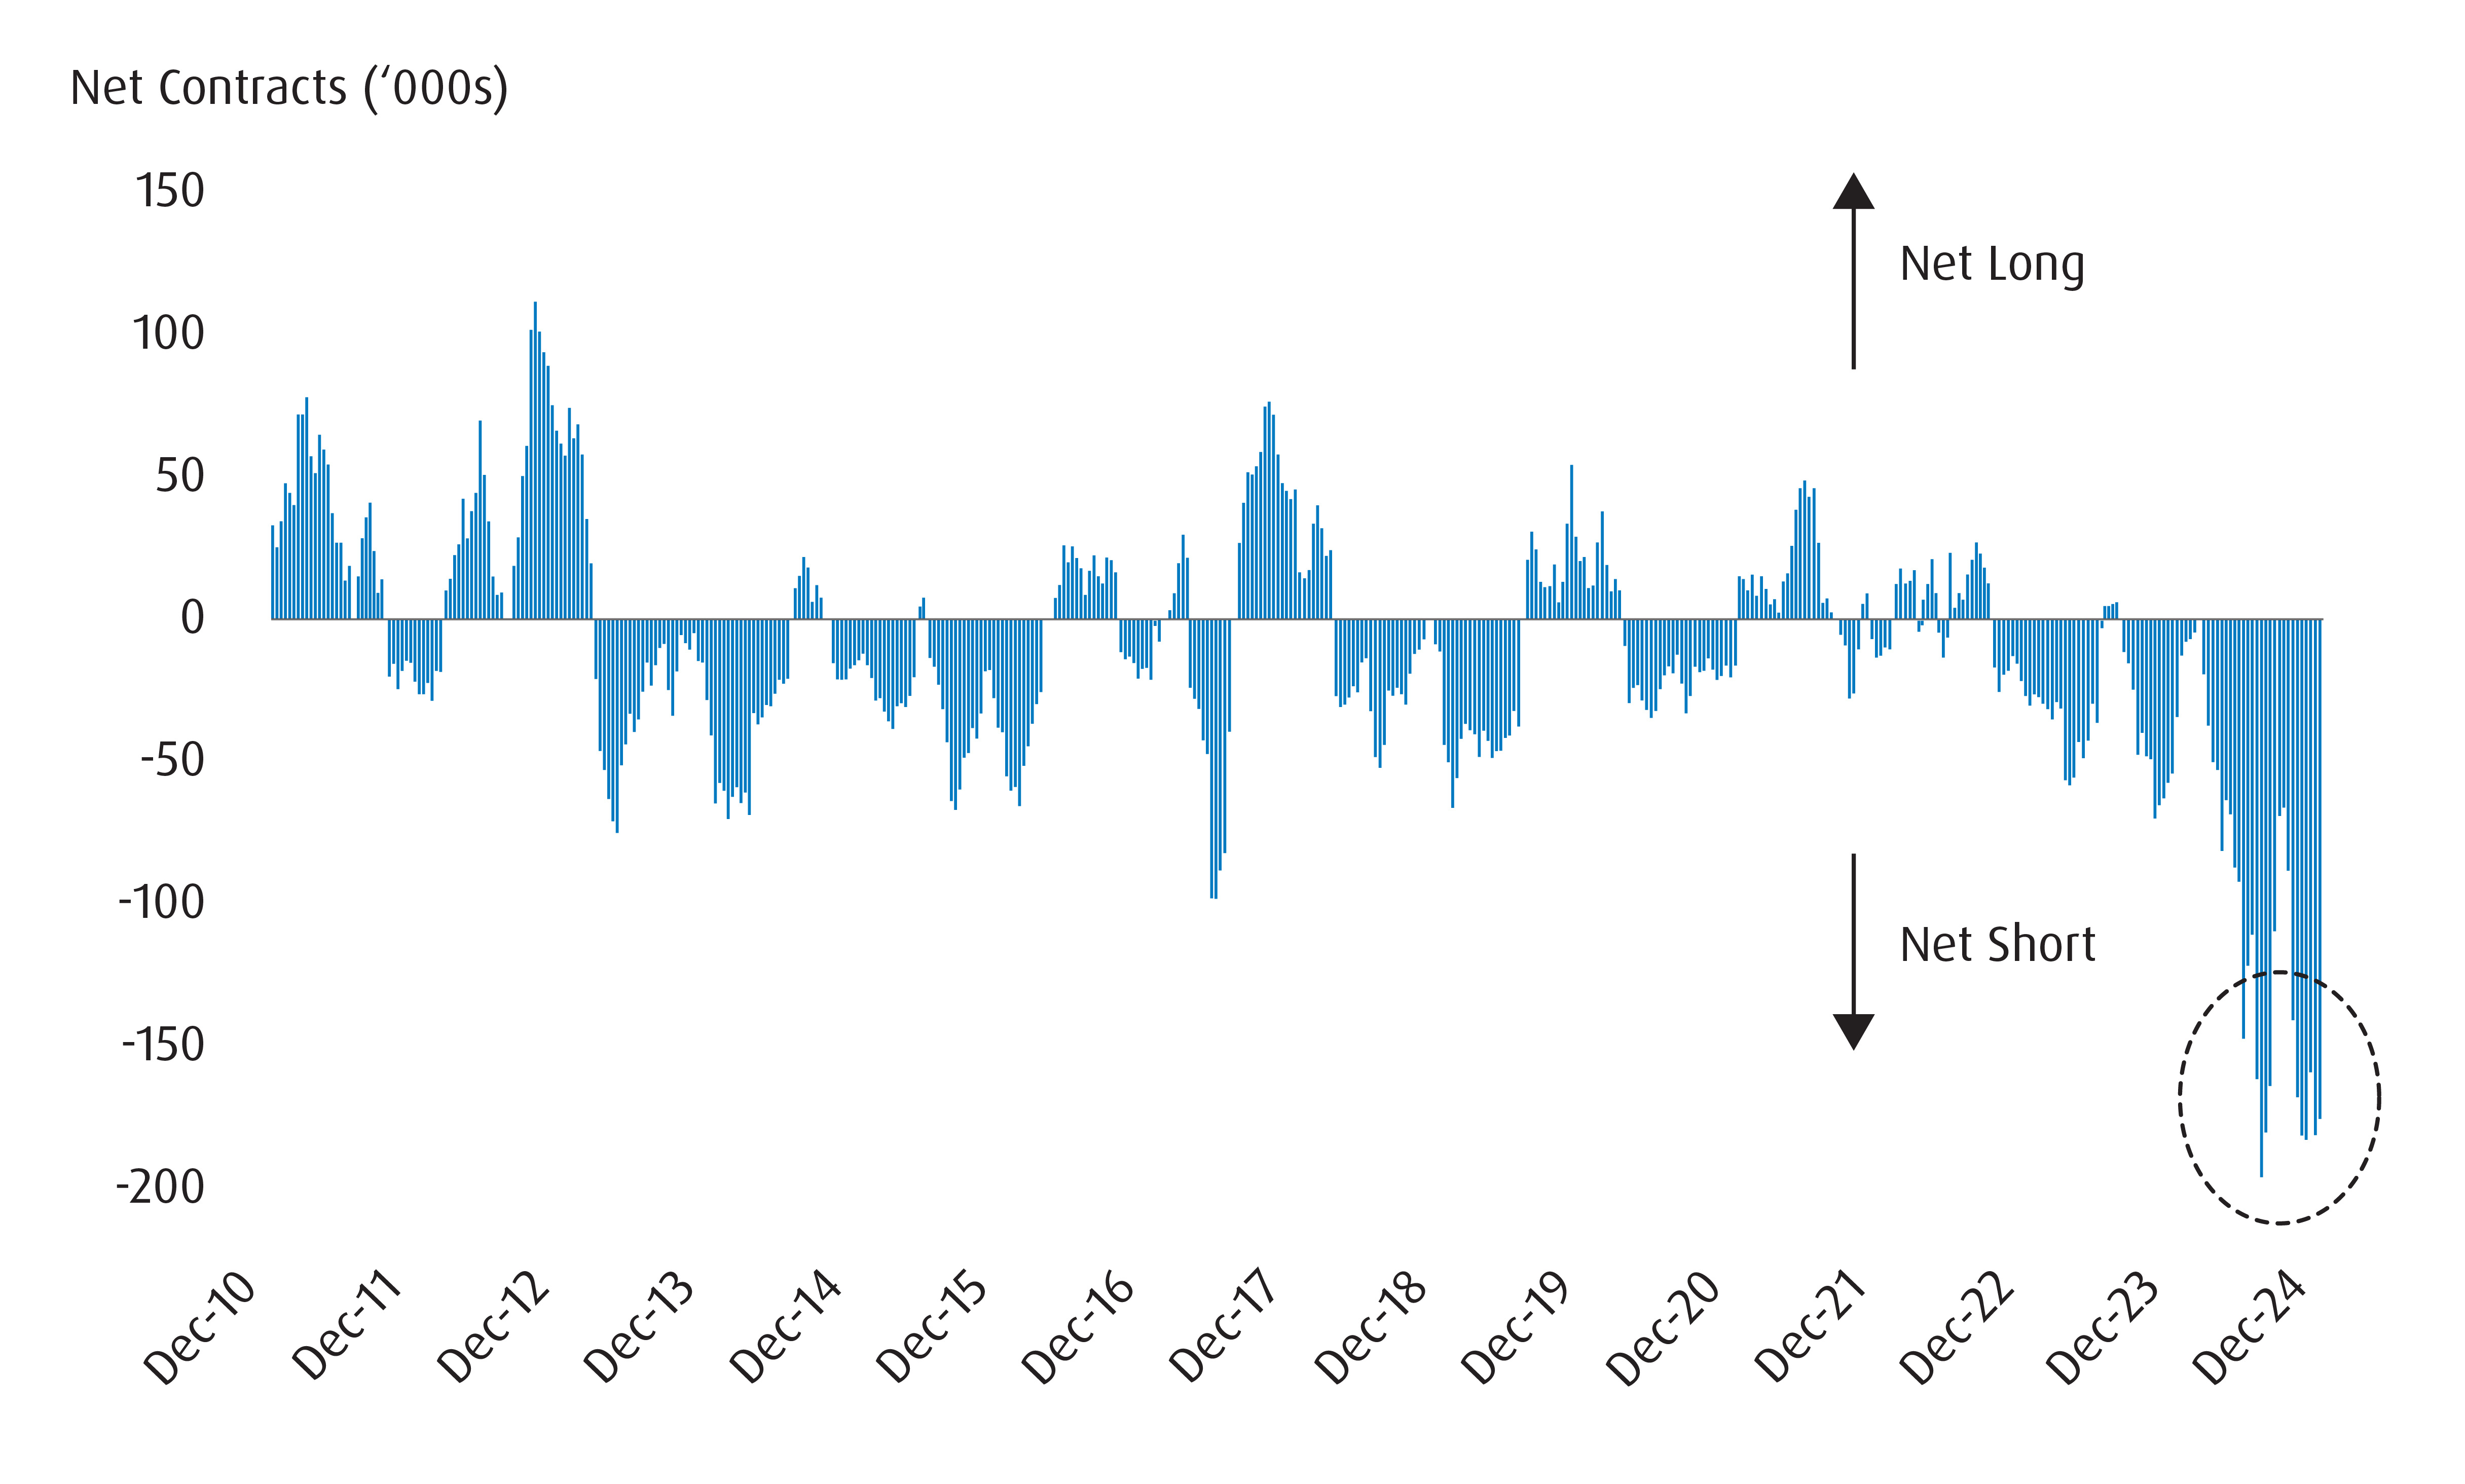
We bring this up because there is a massive net short position that has been built up in the CAD futures market (see Chart 1). This is an important contrarian indicator – rough empirical analysis shows that when positions get large enough, we tend to see a corresponding shift the other way in the underlying currency.
Chart 1 – Net Speculative CAD Positions Close to Extremes
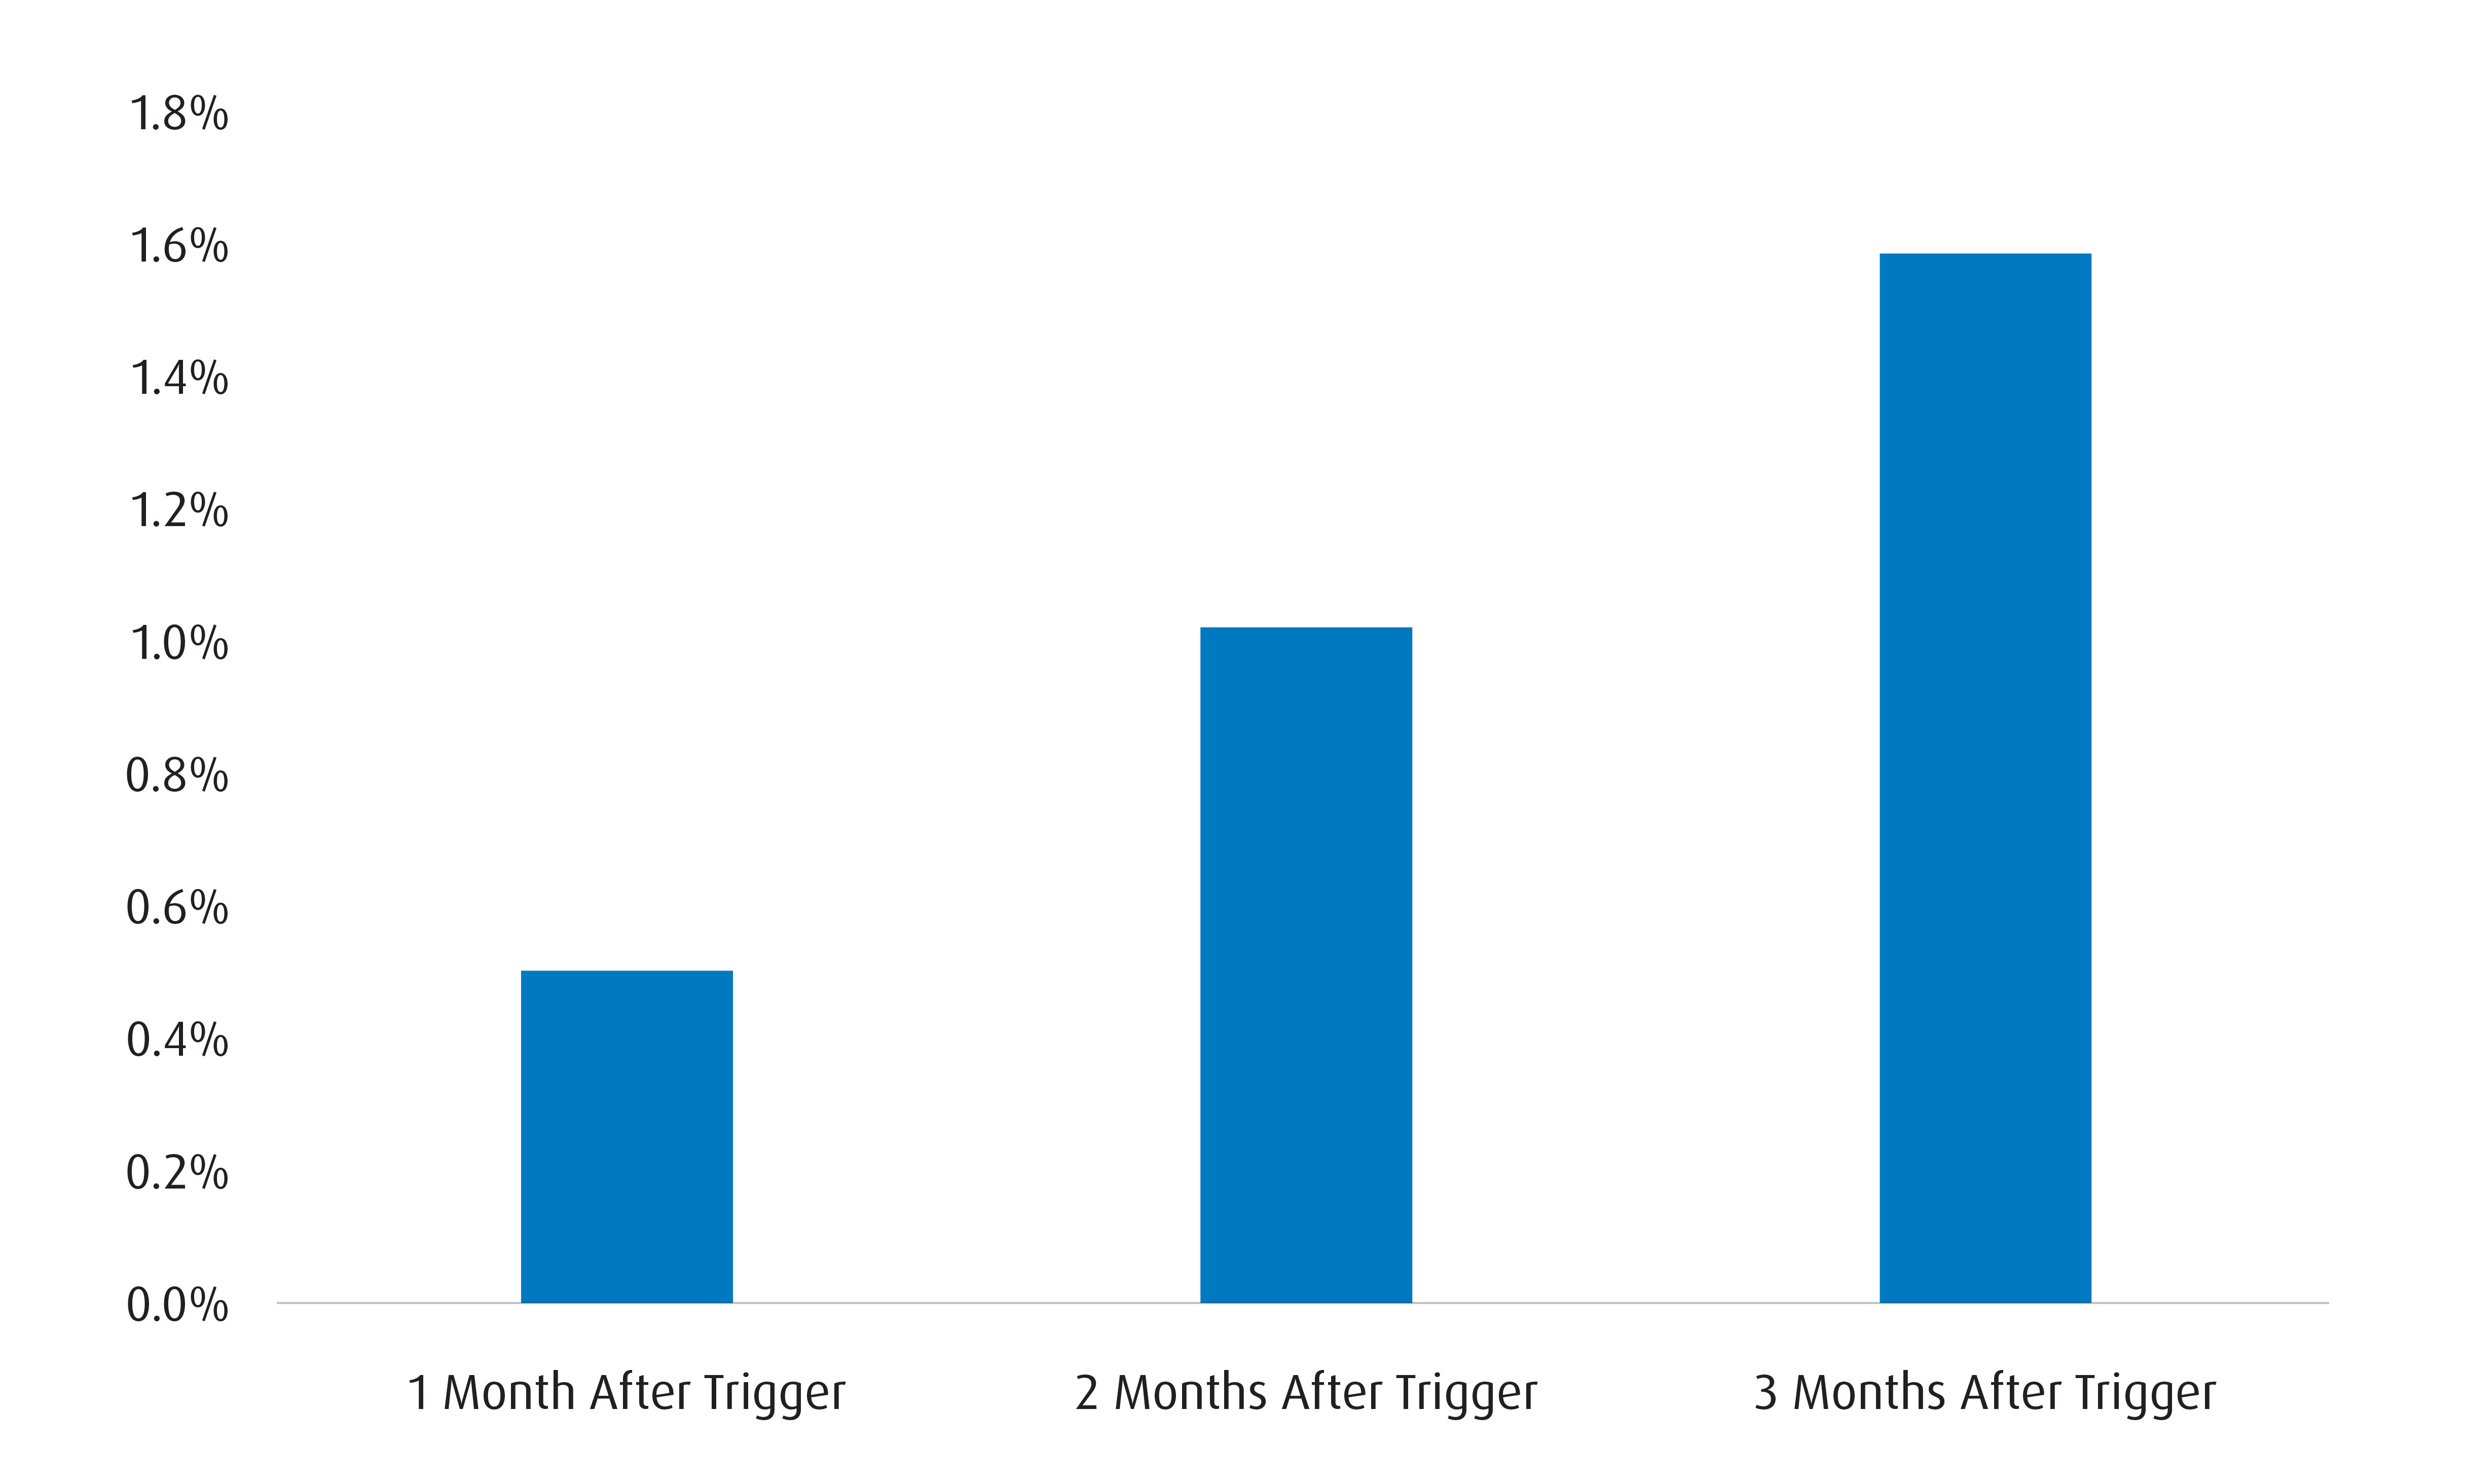
To demonstrate how positioning can be predictive, take Chart 2, which shows the one-, two-, and three-month performance for the U.S. dollar (USD)/Canadian dollar (CAD) after net short CAD positioning in the futures market has reached sizeable levels. To determine what ‘sizeable’ means, we standardize the overall level of positions and use a -1 standard deviation1 as the ‘trigger’ for when we feel that short CAD positioning has become large enough. From Chart 2, we see that USD/CAD has averaged a gain of 0.50% one month after the trigger has been reached over the past 10 years. That return increases to 1.02% two months later and 1.58% three months later.
Chart 2 – Average CAD Return (Against USD) Once Net Shorts Breach Trigger
The current standardized score for positions is -1.2, which tells us that the risks are now skewed towards CAD gains in the coming months. One way to conceptualize this qualitatively is to ask - with a lot of bad news in the price, where is the marginal net short position going to come from?
Indeed, when short positions become this large, it becomes important for investors to consider alternatives. In this case, Canadian investors should look at increasing hedges to protect against risks that the CAD could rally from here. To us, there are two potential sources of ‘surprise’ that could lead investors to exit short CAD positions:
- Canada secures some form of carve-out from tariffs
- The Bank of Canada (BoC) doesn’t cut by as much as the markets expect
The latter is more likely than the former – primarily because monetary policy conditions are ‘passively easing’ already via a weaker CAD. At the margin, that obviates the need for the BoC to ease by as much going further.
In any case, it makes sense for investors to be proactive when it comes to managing their FX exposures from here. Currency markets are both notoriously fickle and extremely unforgiving to those that don’t manage them.
For broad market exposure to U.S. equities, we would recommend the BMO S&P 500 Hedged to CAD Index ETF (Ticker: ZUE). Investors looking for a slightly more defensive posture through a quality screen can consider the BMO MSCI USA High Quality Index ETF - Hedged Units (Ticker: ZUQ.F). Finally, for more cautious investors, the BMO US Equity Buffer Hedged to CAD ETF - January (Ticker: ZJAN) uses ZUE as its underlying reference index, allowing holders to participate in additional U.S. market upside, while providing a “buffer” against downside performance while hedging their currency risk.
Performance (%)
Year-to-Date |
1-Month |
3-Month |
6-Month |
1-Year |
3-Year |
5-Year |
10-Year |
Since Inception |
|
23.44 |
-2.58 |
1.99 |
7.54 |
23.44 |
7.30 |
12.73 |
11.50 |
13.29 |
|
22.18 |
-3.34 |
-1.04 |
3.30 |
22.18 |
7.59 |
- |
- |
14.31 |
|
Returns are not available as there is less than one year’s performance data. |
|||||||||
As of December 31, 2024. Inception dates for ZUE = May 29, 2009, ZUQ.F = July 17, 2020, and ZJAN = January 24, 2024.
1 Standard Deviation: A measure of risk in terms of the volatility of returns. It represents the historical level of volatility in returns over set periods. A lower standard deviation means the returns have historically been less volatile and vice-versa. Historical volatility may not be indicative of future volatility.
Volatility: Measures how much the price of a security, derivative, or index fluctuates. The most commonly used measure of volatility when it comes to investment funds is standard deviation.
BMO Buffer ETFs seeks to provide income and appreciation that match the return of a Reference Index up to a cap (before fees, expenses and taxes), while providing a buffer against the first 15% (before fees, expenses and taxes) of a decrease in the Reference Index over a period of approximately one year, starting from the first business day of the stated outcome period.
Disclaimers:
Changes in rates of exchange may also reduce the value of your investment.
The communication is for information purposes. The information contained herein is not, and should not be construed as, investment, tax or legal advice to any party. Particular investments and/or trading strategies should be evaluated relative to the individual’s investment objectives and professional advice should be obtained with respect to any circumstance.
The viewpoints expressed by the author represents their assessment of the markets at the time of publication. Those views are subject to change without notice at any time. The information provided herein does not constitute a solicitation of an offer to buy, or an offer to sell securities nor should the information be relied upon as investment advice. Past performance is no guarantee of future results. This communication is intended for informational purposes only.
Any statement that necessarily depends on future events may be a forward-looking statement. Forward-looking statements are not guarantees of performance. They involve risks, uncertainties and assumptions. Although such statements are based on assumptions that are believed to be reasonable, there can be no assurance that actual results will not differ materially from expectations. Investors are cautioned not to rely unduly on any forward-looking statements. In connection with any forward-looking statements, investors should carefully consider the areas of risk described in the most recent prospectus.
Commissions, management fees and expenses all may be associated with investments in exchange traded funds. Please read the ETF Facts or prospectus of the BMO ETFs before investing. The indicated rates of return are the historical annual compounded total returns including changes in unit value and reinvestment of all dividends or distributions and do not take into account sales, redemption, distribution or optional charges or income taxes payable by any unitholder that would have reduced returns. Exchange traded funds are not guaranteed, their values change frequently and past performance may not be repeated.
The ETF referred to herein is not sponsored, endorsed, or promoted by MSCI or Bloomberg and they each bear no liability with respect to any such ETF or any index on which such ETF is based. The ETF’s prospectus contains a more detailed description of the limited relationship MSCI or Bloomberg have with the Manager and any related ETF.
The Index is a product of S&P Dow Jones Indices LLC or its affiliates (“SPDJI”), and has been licensed for use by the Manager. S&P®, S&P 500®, US 500, The 500, iBoxx®, iTraxx® and CDX® are trademarks of S&P Global, Inc. or its affiliates (“S&P”) and Dow Jones® is a registered trademark of Dow Jones Trademark Holdings LLC (“Dow Jones”), and these trademarks have been licensed for use by SPDJI and sublicensed for certain purposes by the Manager. The ETF is not sponsored, endorsed, sold or promoted by SPDJI, Dow Jones, S&P, their respective affiliates, and none of such parties make any representation regarding the advisability of investing in such product(s) nor do they have any liability for any errors, omissions, or interruptions of the Index.
An investor that purchases Units of a Structured Outcome ETF other than on the first day of a Target Outcome Period and/or sells Units of a Structured Outcome ETF prior to the end of a Target Outcome Period may experience results that are very different from the target outcomes sought by the Structured Outcome ETF for that Target Outcome Period. Both the cap and, where applicable, the buffer are fixed levels that are calculated in relation to the market price of the applicable Reference ETF and a Structured Outcome ETF’s NAV (as Structured herein) at the start of each Target Outcome Period. As the market price of the applicable Reference ETF and the Structured Outcome ETF’s NAV will change over the Target Outcome Period, an investor acquiring Units of a Structured Outcome ETF after the start of a Target Outcome Period will likely have a different return potential than an investor who purchased Units of a Structured Outcome ETF at the start of the Target Outcome Period. This is because while the cap and, as applicable, the buffer for the Target Outcome Period are fixed levels that remain constant throughout the Target Outcome Period, an investor purchasing Units of a Structured Outcome ETF at market value during the Target Outcome Period likely purchase Units of a Structured Outcome ETF at a market price that is different from the Structured Outcome ETF’s NAV at the start of the Target Outcome Period (i.e., the NAV that the cap and, as applicable, the buffer reference). In addition, the market price of the applicable Reference ETF is likely to be different from the price of that Reference ETF at the start of the Target Outcome Period. To achieve the intended target outcomes sought by a Structured Outcome ETF for a Target Outcome Period, an investor must hold Units of the Structured Outcome ETF for that entire Target Outcome Period.
For a summary of the risks of an investment in the BMO ETFs, please see the specific risks set out in the BMO ETF’s prospectus. BMO ETFs trade like stocks, fluctuate in market value and may trade at a discount to their net asset value, which may increase the risk of loss. Distributions are not guaranteed and are subject to change and/or elimination.
BMO ETFs are managed by BMO Asset Management Inc., which is an investment fund manager and a portfolio manager, and a separate legal entity from Bank of Montreal.
BMO Global Asset Management is a brand name under which BMO Asset Management Inc. and BMO Investments Inc. operate.
“BMO (M-bar roundel symbol)” is a registered trademark of Bank of Montreal, used under licence.
January 15, 2025